| __timestamp | Builders FirstSource, Inc. | United Rentals, Inc. |
|---|---|---|
| Wednesday, January 1, 2014 | 60008000 | 1678000000 |
| Thursday, January 1, 2015 | 148897000 | 2653000000 |
| Friday, January 1, 2016 | 346129000 | 2566000000 |
| Sunday, January 1, 2017 | 378096000 | 2843000000 |
| Monday, January 1, 2018 | 466874000 | 3628000000 |
| Tuesday, January 1, 2019 | 492344000 | 4200000000 |
| Wednesday, January 1, 2020 | 660420000 | 2195000000 |
| Friday, January 1, 2021 | 2934776000 | 2642000000 |
| Saturday, January 1, 2022 | 4267346000 | 5464000000 |
| Sunday, January 1, 2023 | 2734594000 | 6627000000 |
| Monday, January 1, 2024 | 4516000000 |
Unleashing insights
In the competitive landscape of the construction and rental industry, United Rentals, Inc. and Builders FirstSource, Inc. have emerged as formidable players. Over the past decade, United Rentals has consistently outperformed Builders FirstSource in terms of EBITDA, showcasing a robust growth trajectory. From 2014 to 2023, United Rentals' EBITDA surged by nearly 295%, peaking in 2023, while Builders FirstSource experienced a remarkable 4,456% increase, albeit from a much smaller base.
United Rentals' strategic expansions and acquisitions have fueled its growth, particularly evident in 2023 when its EBITDA reached an impressive $6.6 billion. Meanwhile, Builders FirstSource's EBITDA saw a significant leap in 2022, marking a pivotal year with a 45% increase from the previous year. However, data for 2024 remains incomplete, leaving room for speculation on future trends. This comparison highlights the dynamic nature of the industry and the strategic maneuvers of these two giants.
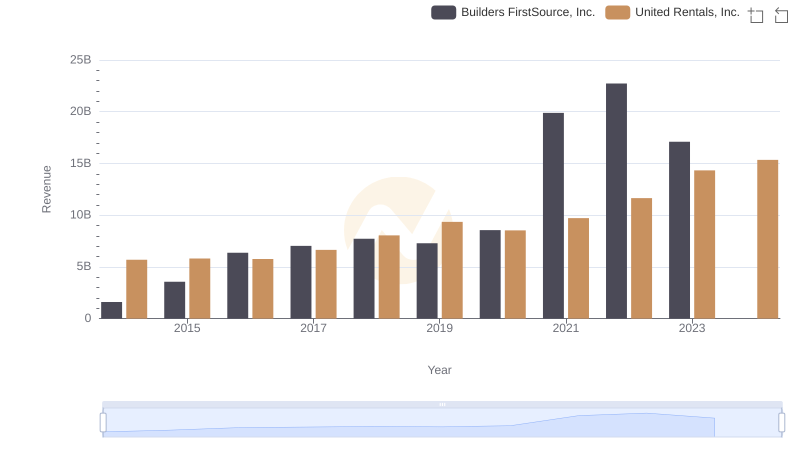
United Rentals, Inc. or Builders FirstSource, Inc.: Who Leads in Yearly Revenue?
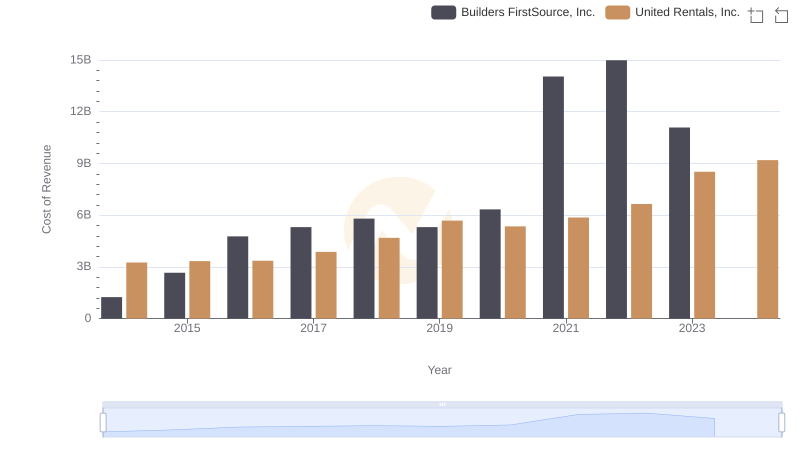
Cost Insights: Breaking Down United Rentals, Inc. and Builders FirstSource, Inc.'s Expenses
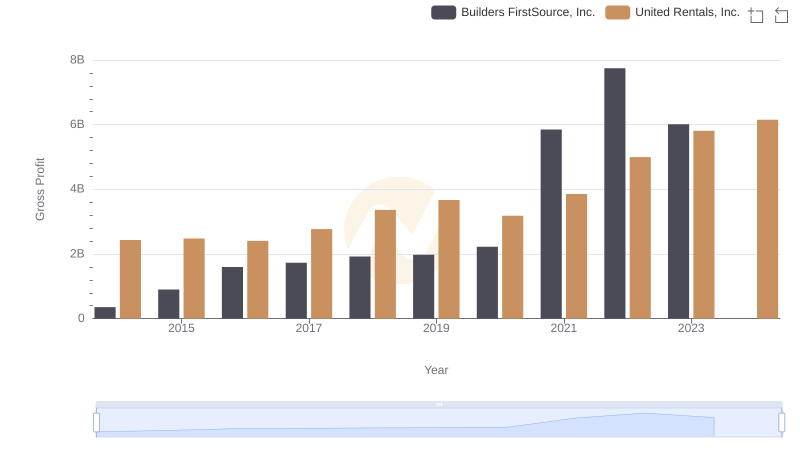
Gross Profit Comparison: United Rentals, Inc. and Builders FirstSource, Inc. Trends
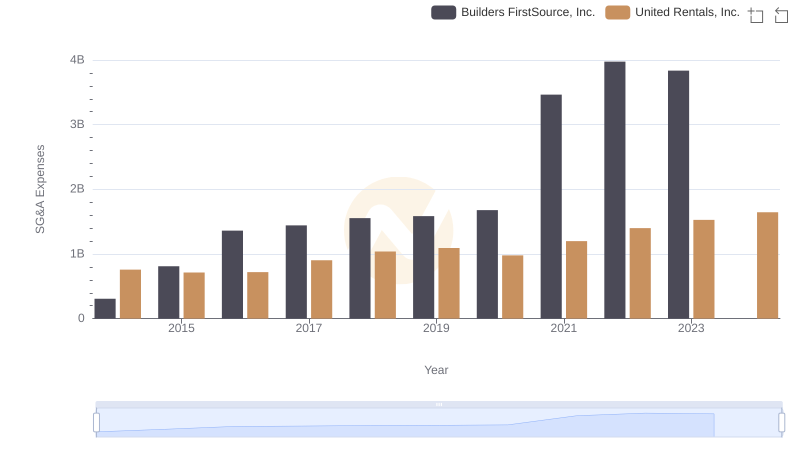
Who Optimizes SG&A Costs Better? United Rentals, Inc. or Builders FirstSource, Inc.
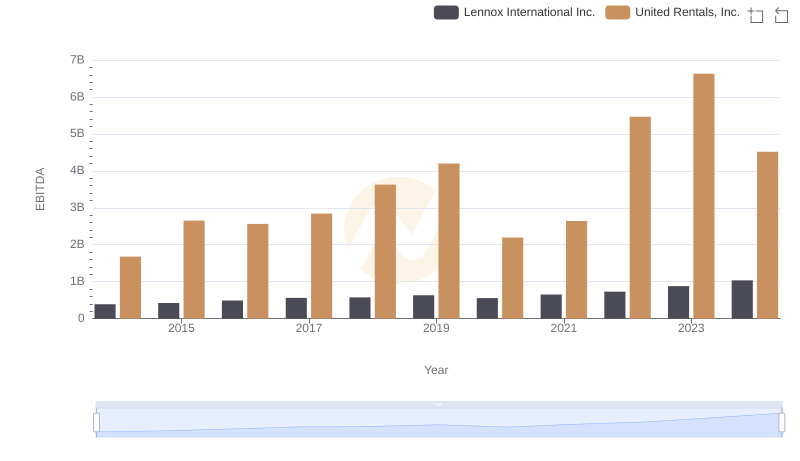
EBITDA Performance Review: United Rentals, Inc. vs Lennox International Inc.
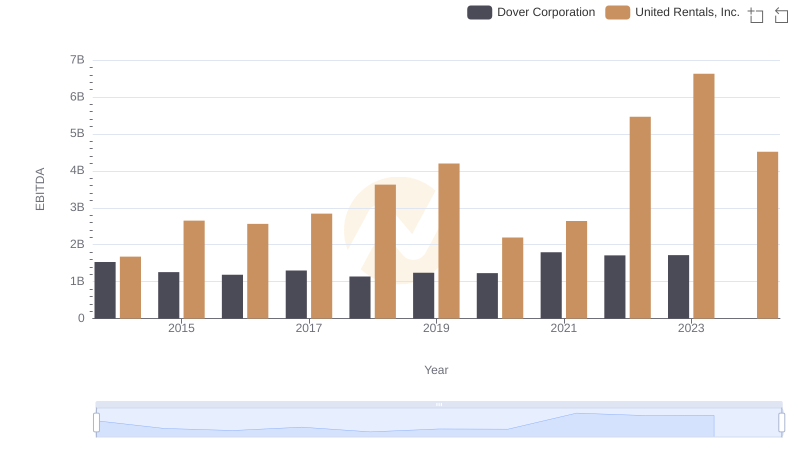
Comparative EBITDA Analysis: United Rentals, Inc. vs Dover Corporation
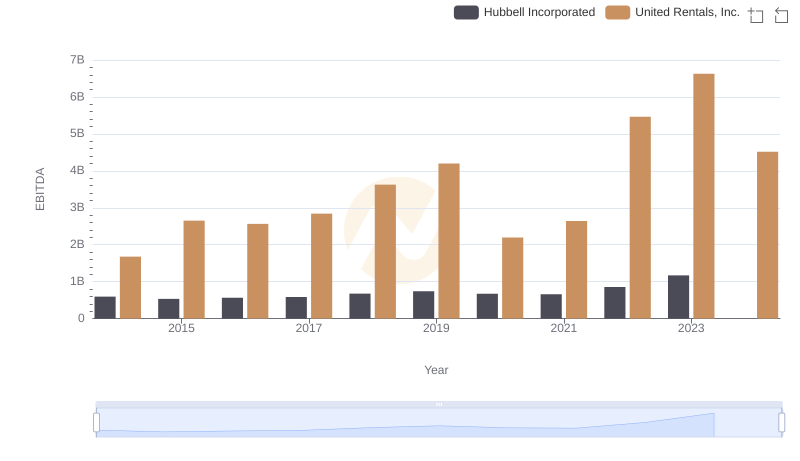
EBITDA Analysis: Evaluating United Rentals, Inc. Against Hubbell Incorporated

Comprehensive EBITDA Comparison: United Rentals, Inc. vs EMCOR Group, Inc.
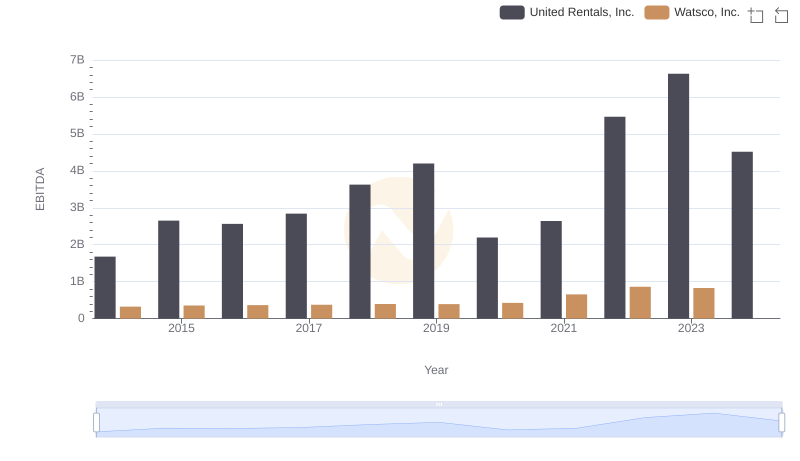
EBITDA Analysis: Evaluating United Rentals, Inc. Against Watsco, Inc.
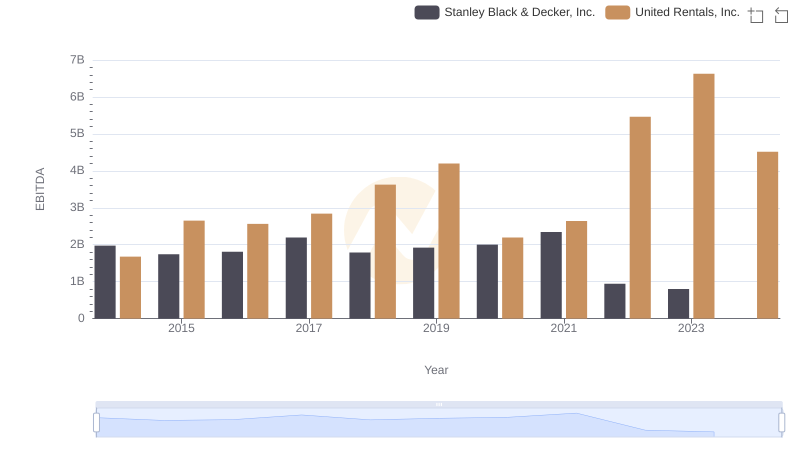
A Side-by-Side Analysis of EBITDA: United Rentals, Inc. and Stanley Black & Decker, Inc.
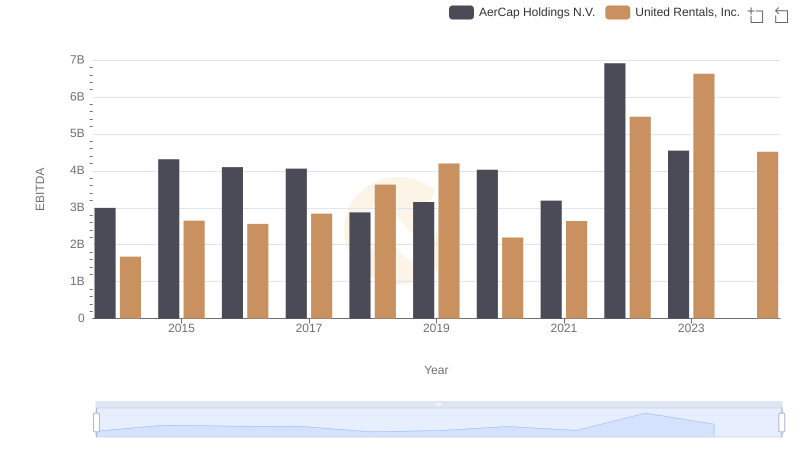
Comparative EBITDA Analysis: United Rentals, Inc. vs AerCap Holdings N.V.
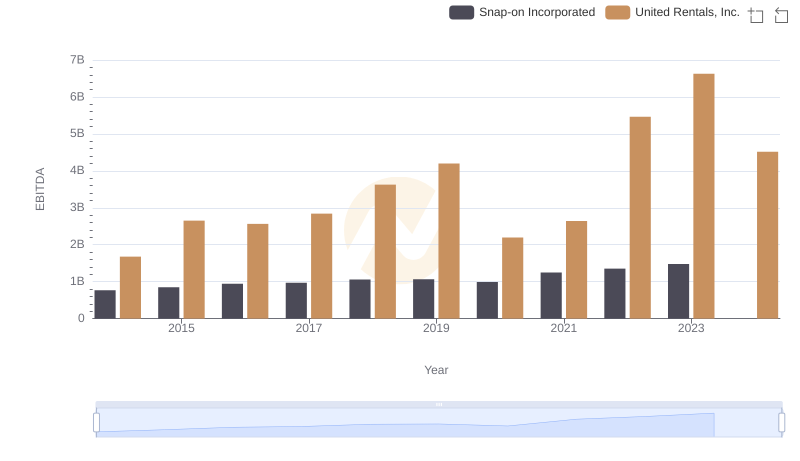
Comparative EBITDA Analysis: United Rentals, Inc. vs Snap-on Incorporated