| __timestamp | Hubbell Incorporated | United Rentals, Inc. |
|---|---|---|
| Wednesday, January 1, 2014 | 3359400000 | 5685000000 |
| Thursday, January 1, 2015 | 3390400000 | 5817000000 |
| Friday, January 1, 2016 | 3505200000 | 5762000000 |
| Sunday, January 1, 2017 | 3668800000 | 6641000000 |
| Monday, January 1, 2018 | 4481700000 | 8047000000 |
| Tuesday, January 1, 2019 | 4591000000 | 9351000000 |
| Wednesday, January 1, 2020 | 4186000000 | 8530000000 |
| Friday, January 1, 2021 | 4194100000 | 9716000000 |
| Saturday, January 1, 2022 | 4947900000 | 11642000000 |
| Sunday, January 1, 2023 | 5372900000 | 14332000000 |
| Monday, January 1, 2024 | 5628500000 | 15345000000 |
Unleashing the power of data
In the competitive landscape of industrial equipment and electrical products, United Rentals, Inc. and Hubbell Incorporated have showcased remarkable revenue trajectories over the past decade. Since 2014, United Rentals has consistently outpaced Hubbell, with its revenue growing by approximately 170% by 2023. This growth is highlighted by a significant leap from 2018 to 2023, where United Rentals' revenue surged by nearly 78%, reaching a peak of $14.3 billion in 2023.
Conversely, Hubbell Incorporated, while maintaining steady growth, saw its revenue increase by about 60% over the same period, culminating in $5.4 billion in 2023. This steady climb reflects Hubbell's resilience and strategic positioning in the market.
The data for 2024 is incomplete, but the trends suggest that United Rentals is poised to continue its upward trajectory, potentially surpassing its previous records. This analysis underscores the dynamic nature of the industrial sector and the strategic maneuvers of these two giants.
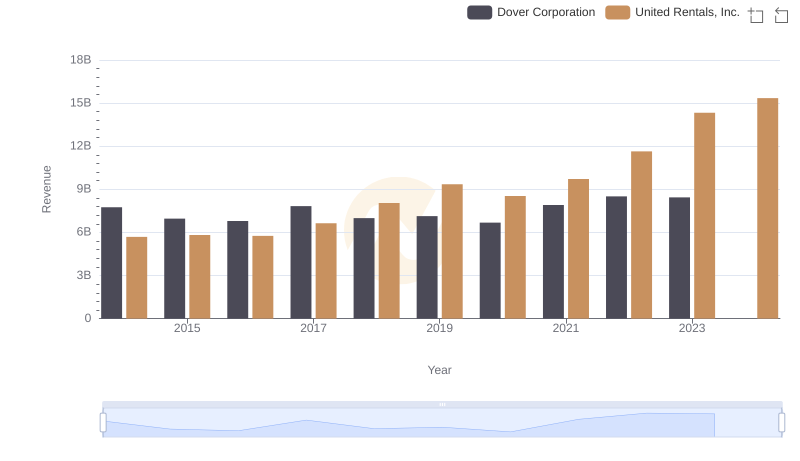
United Rentals, Inc. or Dover Corporation: Who Leads in Yearly Revenue?
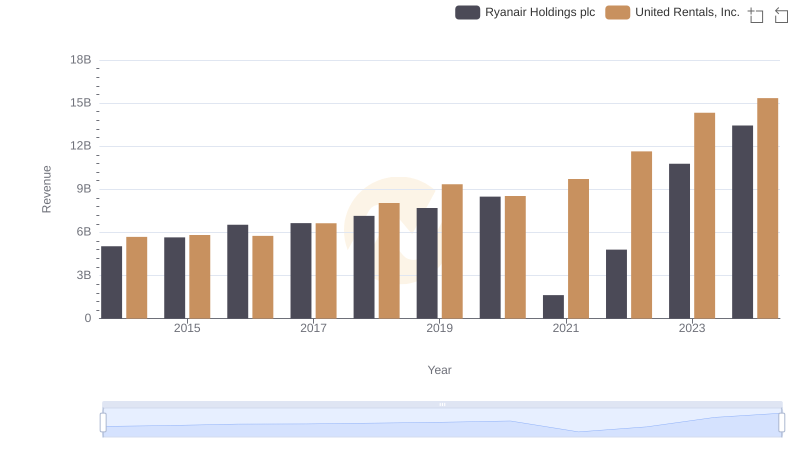
Revenue Insights: United Rentals, Inc. and Ryanair Holdings plc Performance Compared
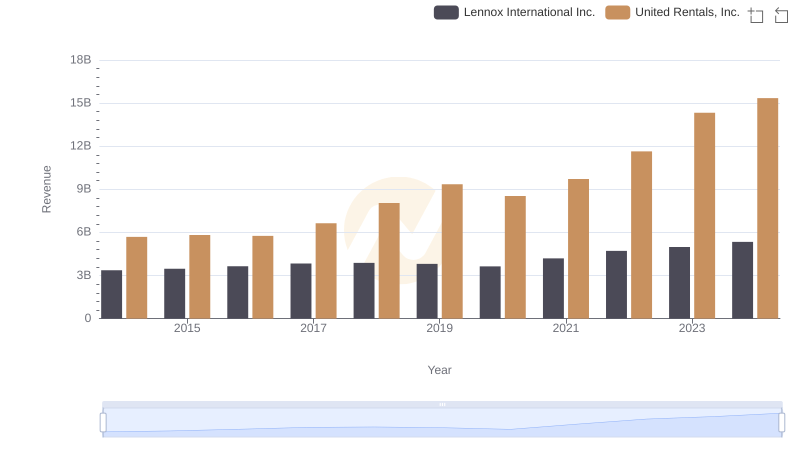
United Rentals, Inc. vs Lennox International Inc.: Annual Revenue Growth Compared
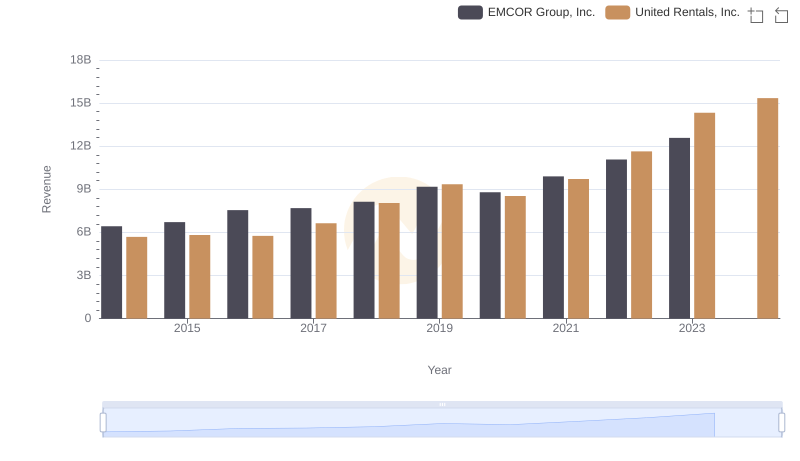
United Rentals, Inc. vs EMCOR Group, Inc.: Examining Key Revenue Metrics
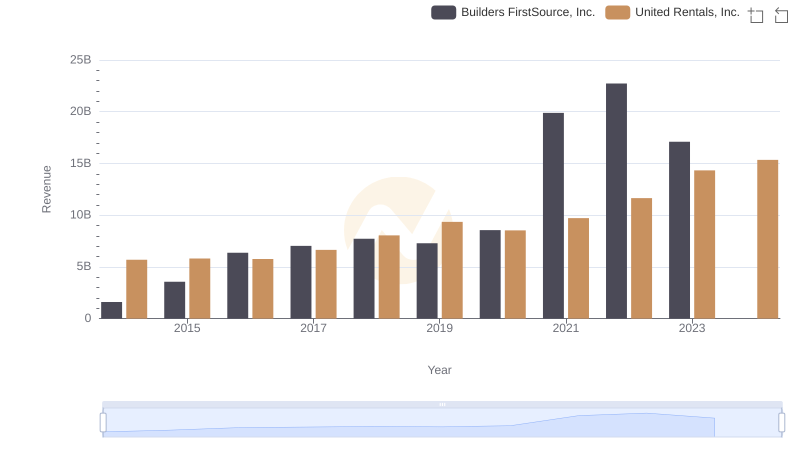
United Rentals, Inc. or Builders FirstSource, Inc.: Who Leads in Yearly Revenue?
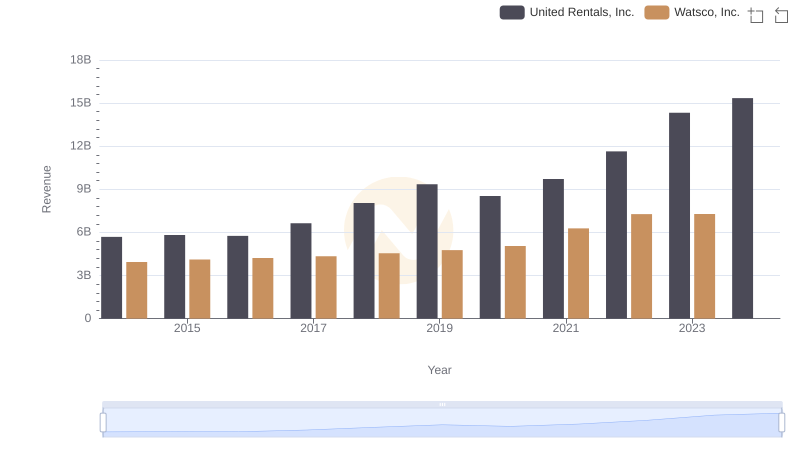
United Rentals, Inc. or Watsco, Inc.: Who Leads in Yearly Revenue?
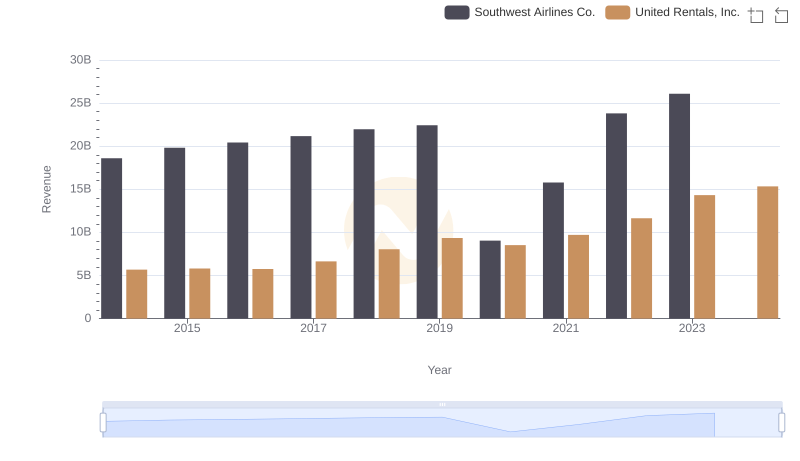
Comparing Revenue Performance: United Rentals, Inc. or Southwest Airlines Co.?
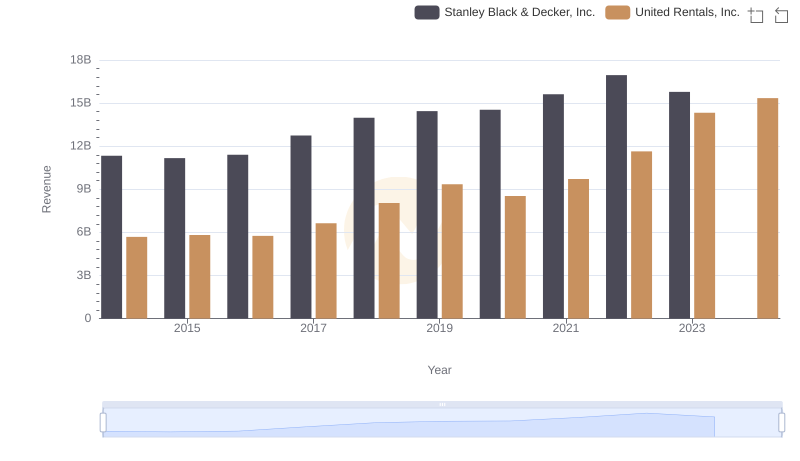
Comparing Revenue Performance: United Rentals, Inc. or Stanley Black & Decker, Inc.?
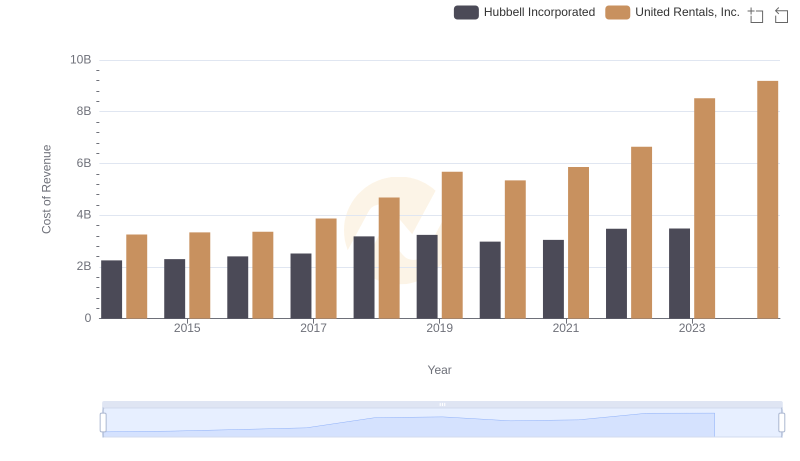
Comparing Cost of Revenue Efficiency: United Rentals, Inc. vs Hubbell Incorporated
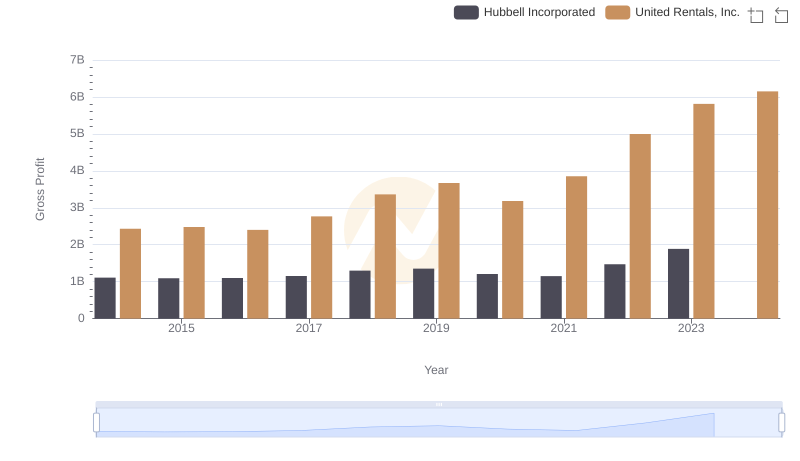
Who Generates Higher Gross Profit? United Rentals, Inc. or Hubbell Incorporated
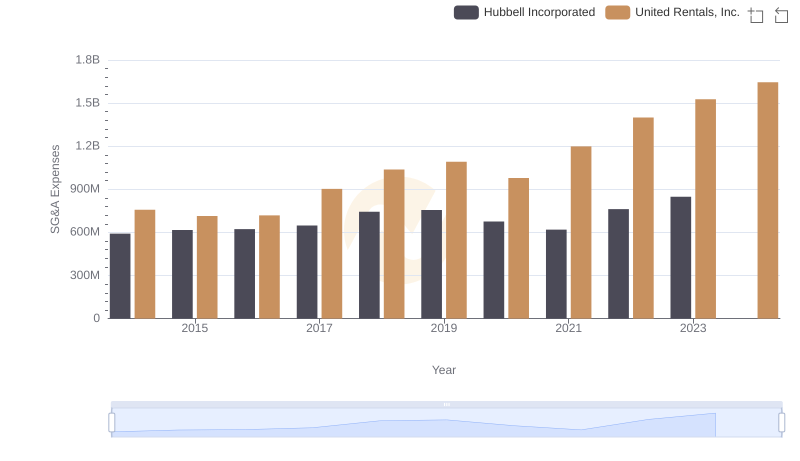
Who Optimizes SG&A Costs Better? United Rentals, Inc. or Hubbell Incorporated
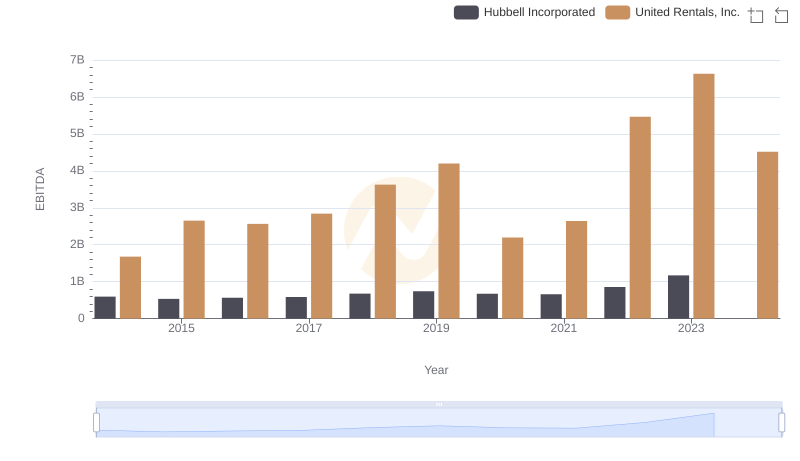
EBITDA Analysis: Evaluating United Rentals, Inc. Against Hubbell Incorporated