| __timestamp | United Rentals, Inc. | Watsco, Inc. |
|---|---|---|
| Wednesday, January 1, 2014 | 1678000000 | 323674000 |
| Thursday, January 1, 2015 | 2653000000 | 355865000 |
| Friday, January 1, 2016 | 2566000000 | 365698000 |
| Sunday, January 1, 2017 | 2843000000 | 375907000 |
| Monday, January 1, 2018 | 3628000000 | 394177000 |
| Tuesday, January 1, 2019 | 4200000000 | 391396000 |
| Wednesday, January 1, 2020 | 2195000000 | 426942000 |
| Friday, January 1, 2021 | 2642000000 | 656655000 |
| Saturday, January 1, 2022 | 5464000000 | 863261000 |
| Sunday, January 1, 2023 | 6627000000 | 829900000 |
| Monday, January 1, 2024 | 4516000000 | 781775000 |
Cracking the code
In the ever-evolving landscape of industrial and HVAC sectors, United Rentals, Inc. and Watsco, Inc. have demonstrated remarkable financial trajectories over the past decade. United Rentals, a leader in equipment rental, has seen its EBITDA grow by nearly 295% from 2014 to 2023, peaking in 2023 with a staggering $6.6 billion. This growth underscores the company's strategic expansions and robust market demand.
Conversely, Watsco, a prominent player in the HVAC distribution industry, has experienced a steady EBITDA increase of approximately 157% over the same period, reaching its zenith in 2022. However, 2024 data for Watsco remains elusive, leaving room for speculation on its future performance.
This comparative analysis not only highlights the resilience and adaptability of these industry giants but also offers valuable insights into their financial health and strategic positioning in a competitive market.
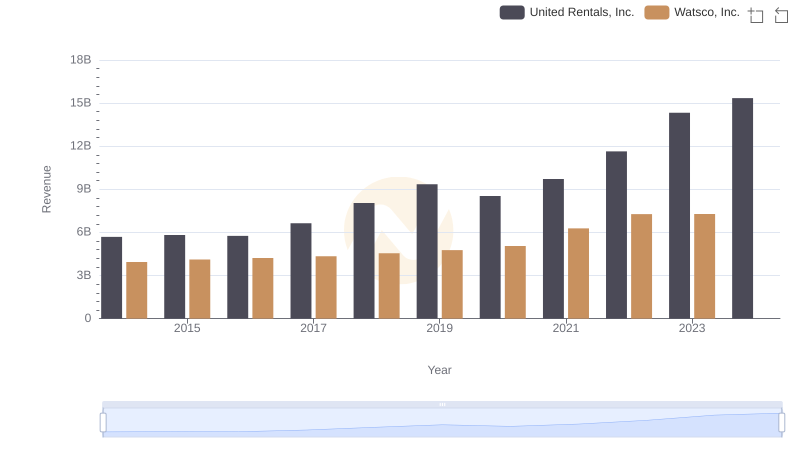
United Rentals, Inc. or Watsco, Inc.: Who Leads in Yearly Revenue?
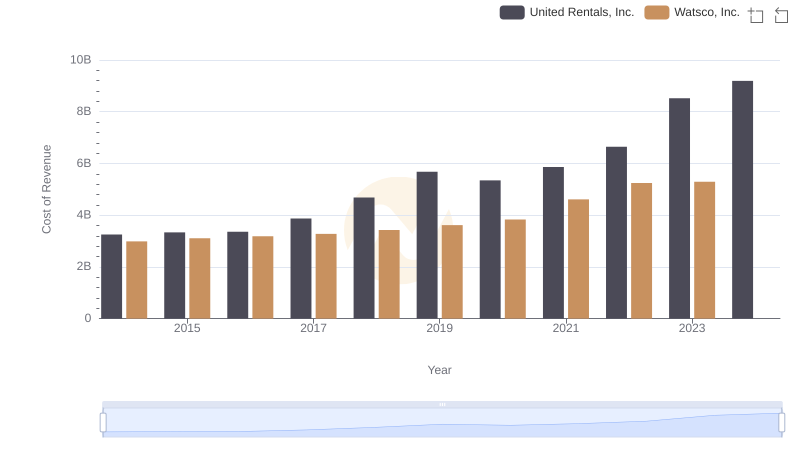
United Rentals, Inc. vs Watsco, Inc.: Efficiency in Cost of Revenue Explored
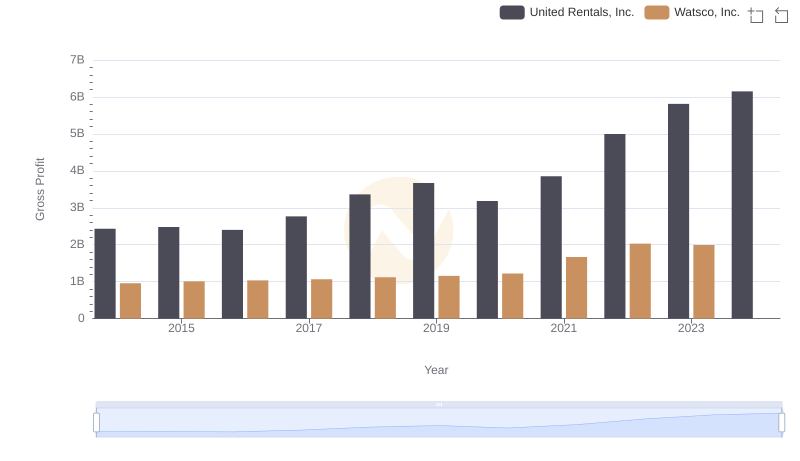
Gross Profit Analysis: Comparing United Rentals, Inc. and Watsco, Inc.
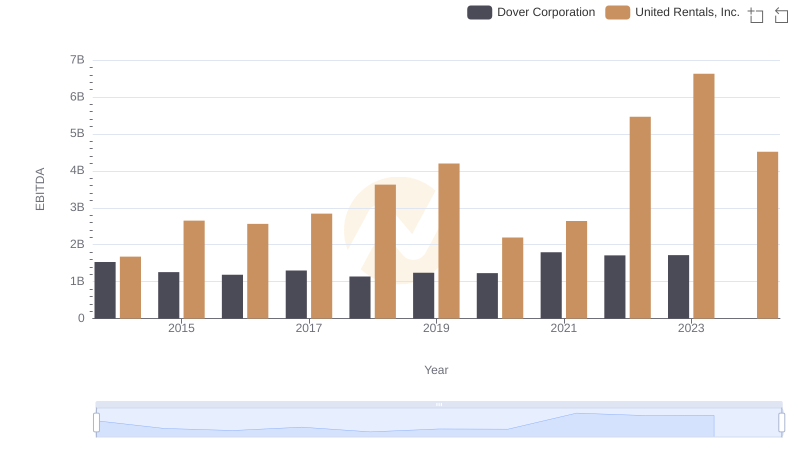
Comparative EBITDA Analysis: United Rentals, Inc. vs Dover Corporation
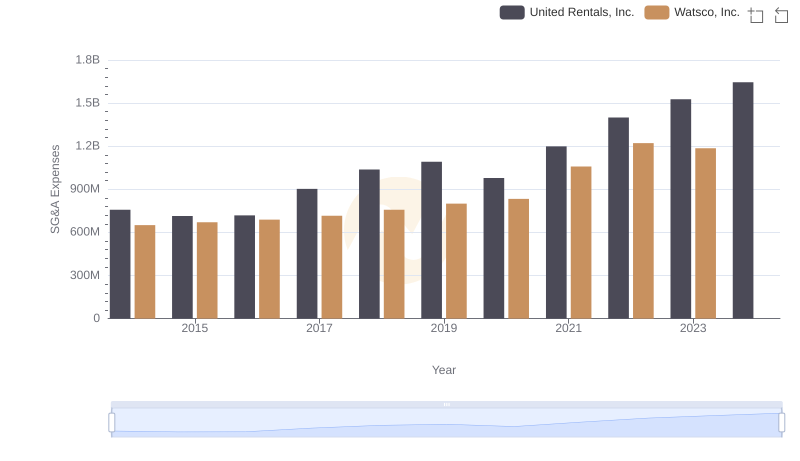
Cost Management Insights: SG&A Expenses for United Rentals, Inc. and Watsco, Inc.
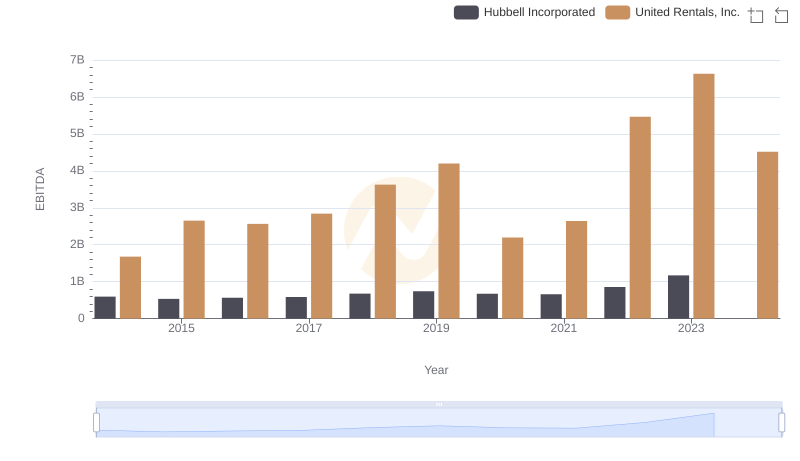
EBITDA Analysis: Evaluating United Rentals, Inc. Against Hubbell Incorporated

Comprehensive EBITDA Comparison: United Rentals, Inc. vs EMCOR Group, Inc.
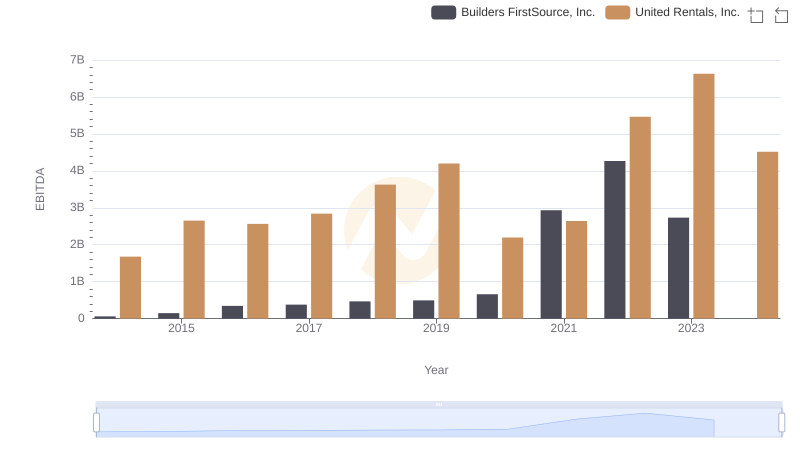
United Rentals, Inc. vs Builders FirstSource, Inc.: In-Depth EBITDA Performance Comparison
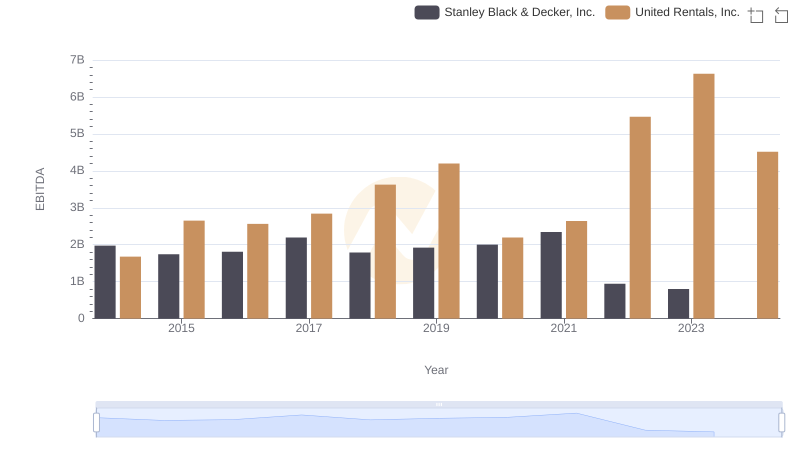
A Side-by-Side Analysis of EBITDA: United Rentals, Inc. and Stanley Black & Decker, Inc.
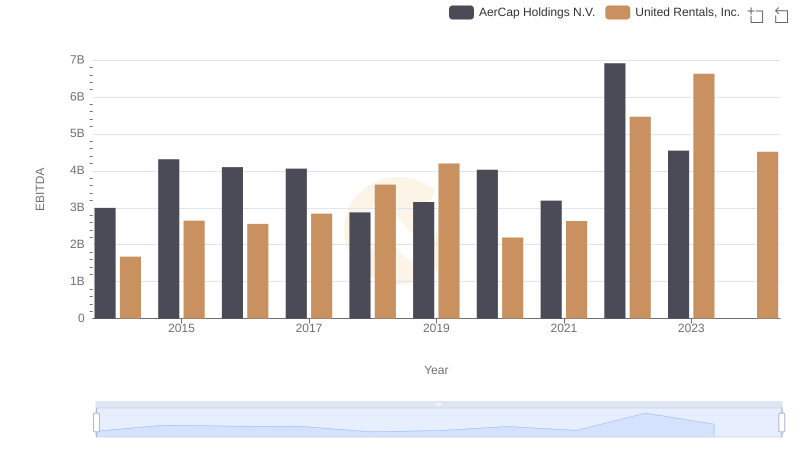
Comparative EBITDA Analysis: United Rentals, Inc. vs AerCap Holdings N.V.
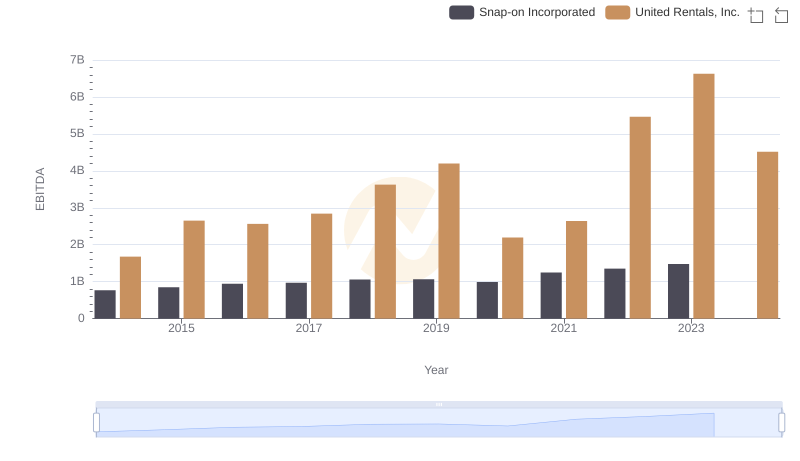
Comparative EBITDA Analysis: United Rentals, Inc. vs Snap-on Incorporated
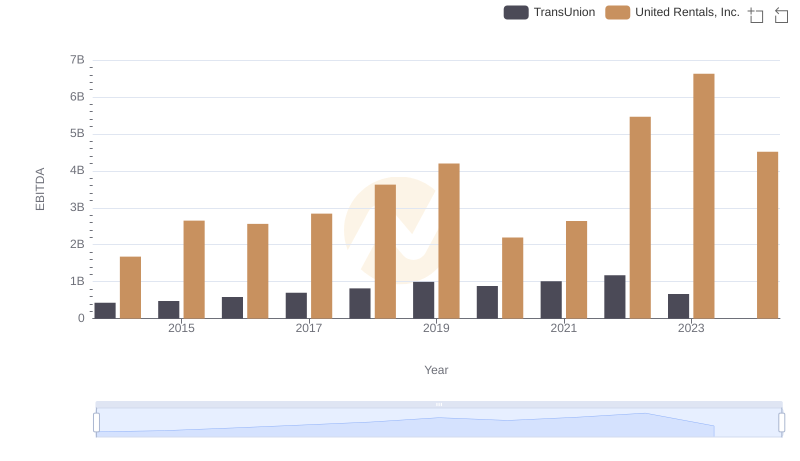
EBITDA Performance Review: United Rentals, Inc. vs TransUnion