| __timestamp | Hubbell Incorporated | United Rentals, Inc. |
|---|---|---|
| Wednesday, January 1, 2014 | 2250400000 | 3253000000 |
| Thursday, January 1, 2015 | 2298600000 | 3337000000 |
| Friday, January 1, 2016 | 2404500000 | 3359000000 |
| Sunday, January 1, 2017 | 2516900000 | 3872000000 |
| Monday, January 1, 2018 | 3181300000 | 4683000000 |
| Tuesday, January 1, 2019 | 3238300000 | 5681000000 |
| Wednesday, January 1, 2020 | 2976700000 | 5347000000 |
| Friday, January 1, 2021 | 3042600000 | 5863000000 |
| Saturday, January 1, 2022 | 3476300000 | 6646000000 |
| Sunday, January 1, 2023 | 3484800000 | 8519000000 |
| Monday, January 1, 2024 | 3724400000 | 9195000000 |
Unleashing the power of data
In the competitive landscape of industrial services, cost efficiency is a critical metric. Over the past decade, United Rentals, Inc. and Hubbell Incorporated have demonstrated contrasting trajectories in their cost of revenue. From 2014 to 2023, United Rentals has consistently outpaced Hubbell, with a notable 162% increase in cost efficiency, peaking at $8.52 billion in 2023. In contrast, Hubbell's cost of revenue grew by approximately 55%, reaching $3.48 billion in the same year.
This divergence highlights United Rentals' aggressive expansion and operational scaling, particularly evident in the 2020s. Meanwhile, Hubbell's steadier growth reflects a more conservative approach. The data for 2024 is incomplete, but the trends suggest United Rentals' continued dominance. As the industrial sector evolves, these insights offer a glimpse into the strategic priorities shaping these industry giants.
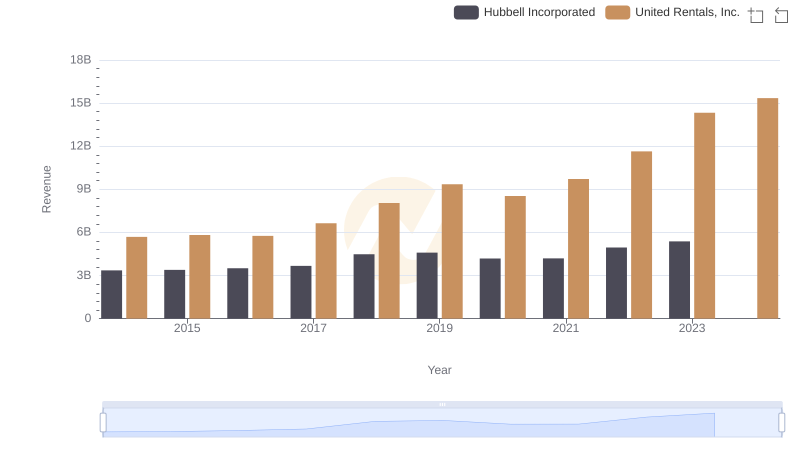
Revenue Showdown: United Rentals, Inc. vs Hubbell Incorporated
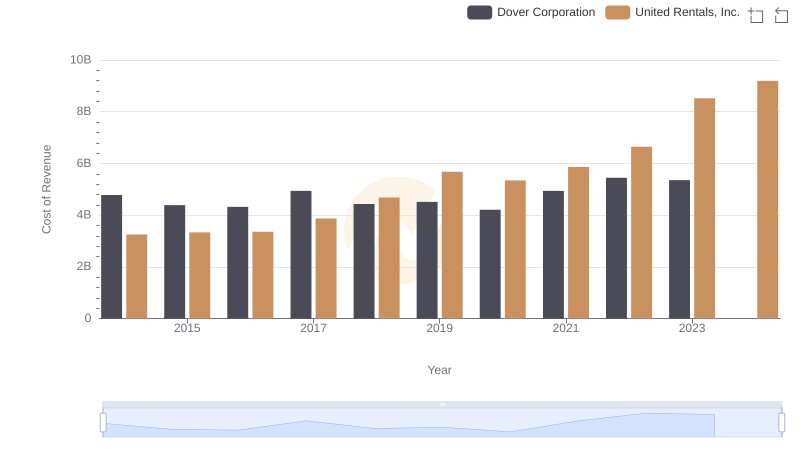
Cost Insights: Breaking Down United Rentals, Inc. and Dover Corporation's Expenses
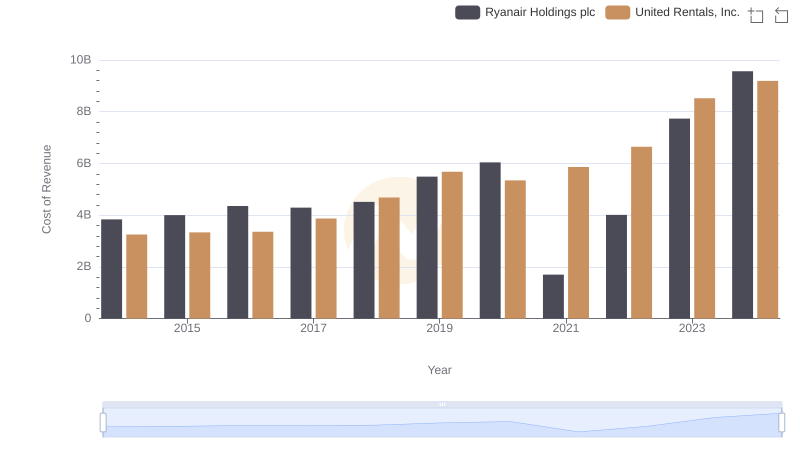
Cost Insights: Breaking Down United Rentals, Inc. and Ryanair Holdings plc's Expenses
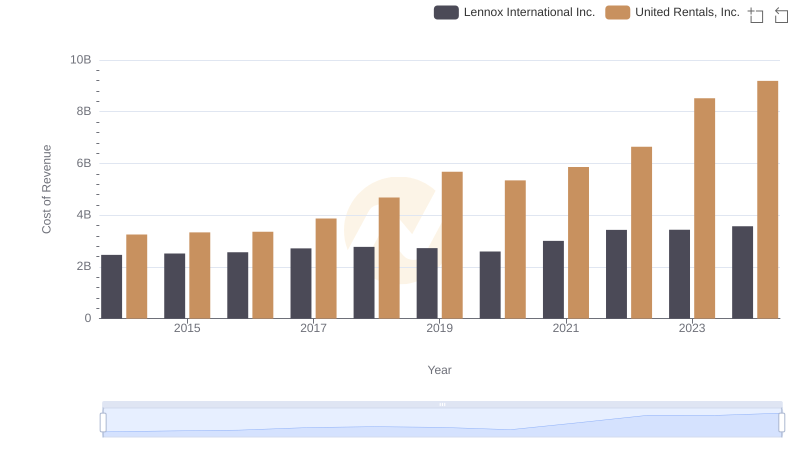
Cost of Revenue Trends: United Rentals, Inc. vs Lennox International Inc.
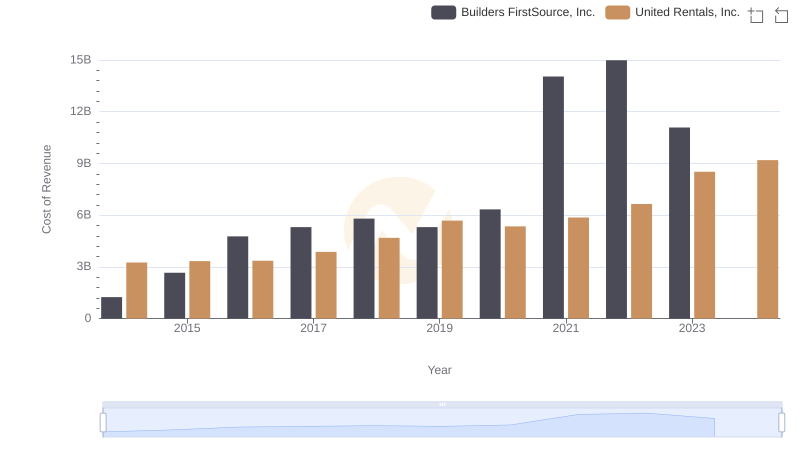
Cost Insights: Breaking Down United Rentals, Inc. and Builders FirstSource, Inc.'s Expenses
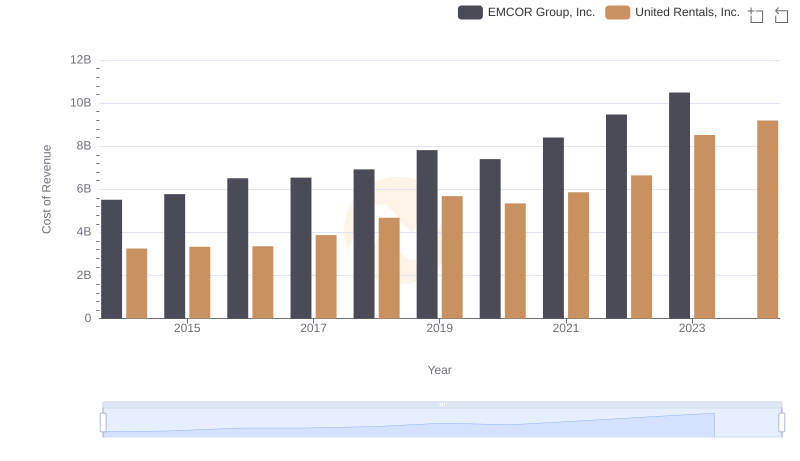
United Rentals, Inc. vs EMCOR Group, Inc.: Efficiency in Cost of Revenue Explored
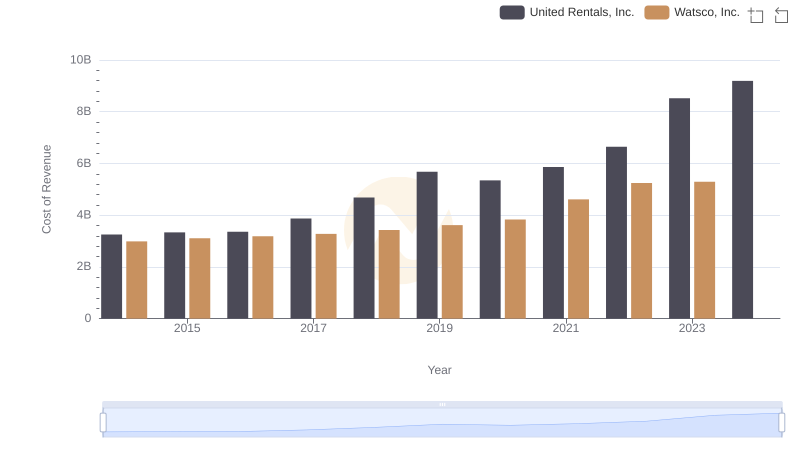
United Rentals, Inc. vs Watsco, Inc.: Efficiency in Cost of Revenue Explored
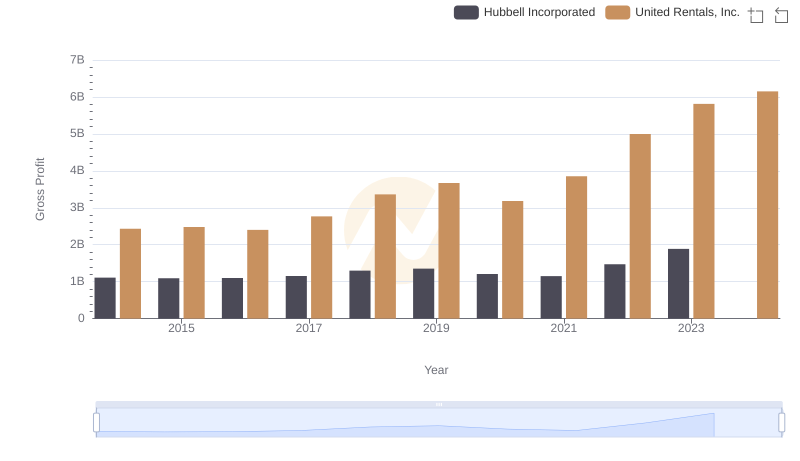
Who Generates Higher Gross Profit? United Rentals, Inc. or Hubbell Incorporated
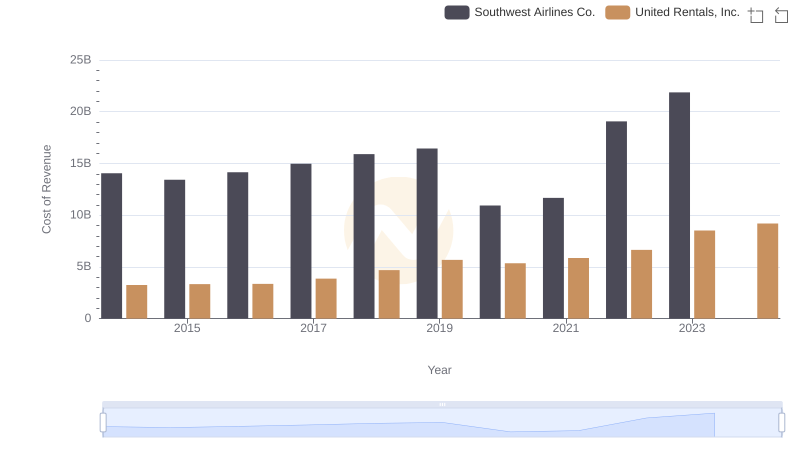
Cost Insights: Breaking Down United Rentals, Inc. and Southwest Airlines Co.'s Expenses
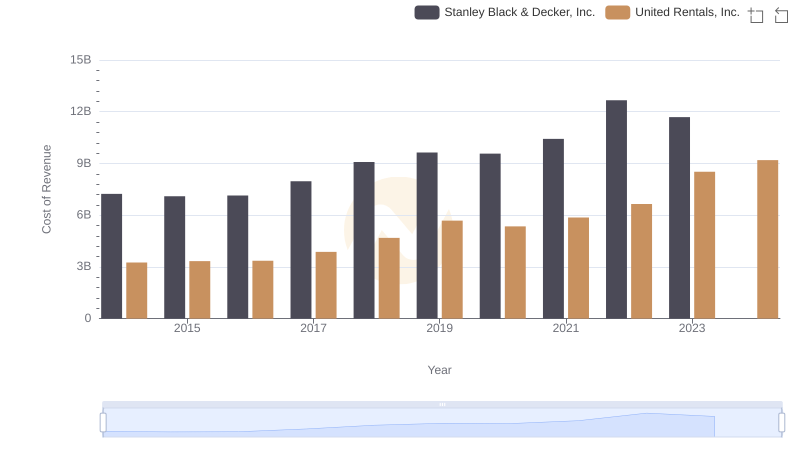
Cost of Revenue Comparison: United Rentals, Inc. vs Stanley Black & Decker, Inc.
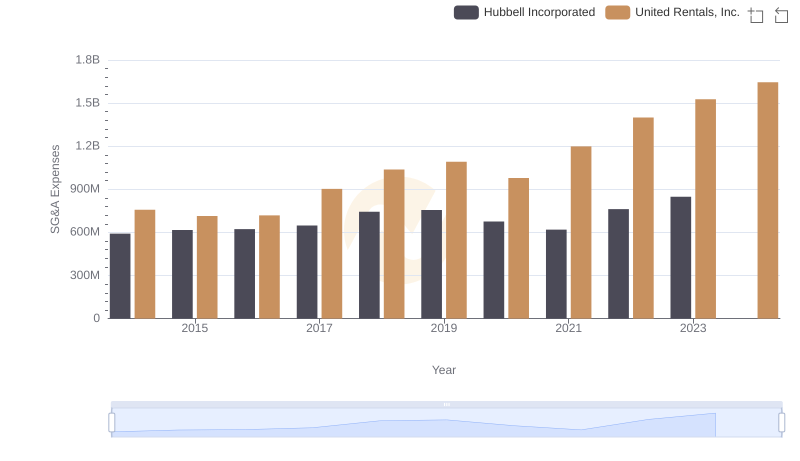
Who Optimizes SG&A Costs Better? United Rentals, Inc. or Hubbell Incorporated
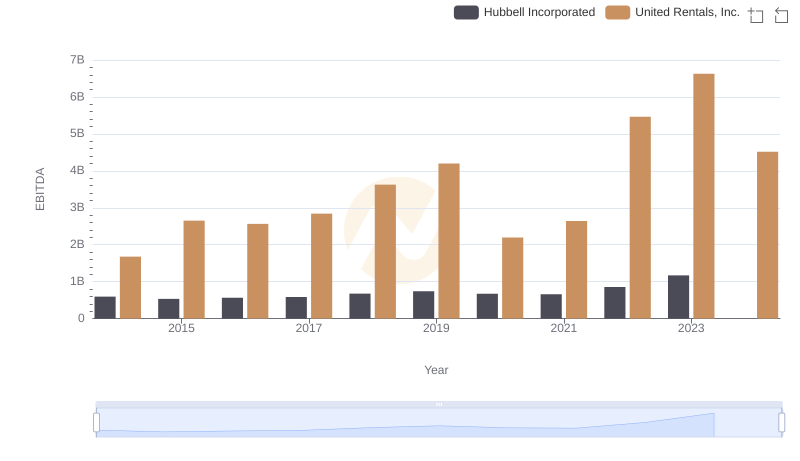
EBITDA Analysis: Evaluating United Rentals, Inc. Against Hubbell Incorporated