| __timestamp | Garmin Ltd. | Intuit Inc. |
|---|---|---|
| Wednesday, January 1, 2014 | 1266246000 | 668000000 |
| Thursday, January 1, 2015 | 1281566000 | 725000000 |
| Friday, January 1, 2016 | 1339095000 | 752000000 |
| Sunday, January 1, 2017 | 1303840000 | 809000000 |
| Monday, January 1, 2018 | 1367725000 | 977000000 |
| Tuesday, January 1, 2019 | 1523529000 | 1167000000 |
| Wednesday, January 1, 2020 | 1705237000 | 1378000000 |
| Friday, January 1, 2021 | 2092336000 | 1683000000 |
| Saturday, January 1, 2022 | 2053511000 | 2406000000 |
| Sunday, January 1, 2023 | 2223297000 | 3143000000 |
| Monday, January 1, 2024 | 2600348000 | 3465000000 |
Cracking the code
In the ever-evolving landscape of technology and consumer electronics, understanding cost structures is pivotal. Over the past decade, Intuit Inc. and Garmin Ltd. have showcased intriguing trends in their cost of revenue. From 2014 to 2023, Garmin Ltd. experienced a steady increase, with costs rising by approximately 76%, peaking in 2023. This reflects Garmin's strategic investments in product development and market expansion.
Conversely, Intuit Inc. demonstrated a more dramatic trajectory. Starting at a lower base in 2014, Intuit's cost of revenue surged by nearly 370% by 2023, indicating aggressive growth and scaling efforts. Notably, 2024 data for Garmin is missing, suggesting potential shifts or reporting delays.
These trends highlight the contrasting strategies of two industry giants, offering insights into their operational priorities and market responses. As the digital economy expands, such analyses become crucial for investors and analysts alike.
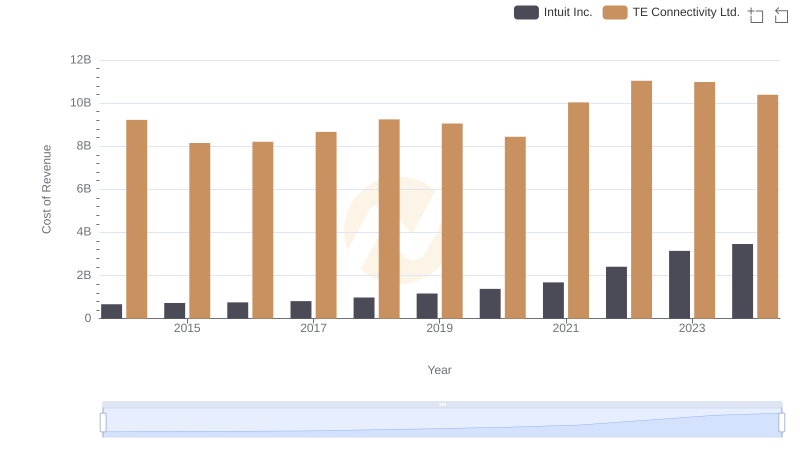
Cost of Revenue: Key Insights for Intuit Inc. and TE Connectivity Ltd.
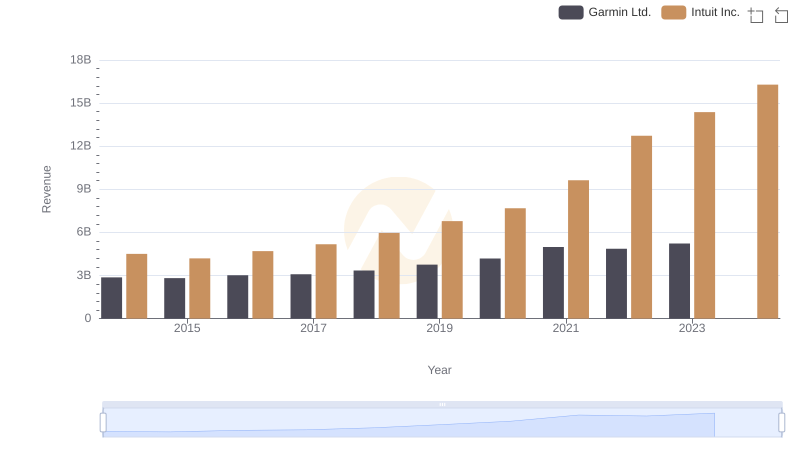
Revenue Showdown: Intuit Inc. vs Garmin Ltd.
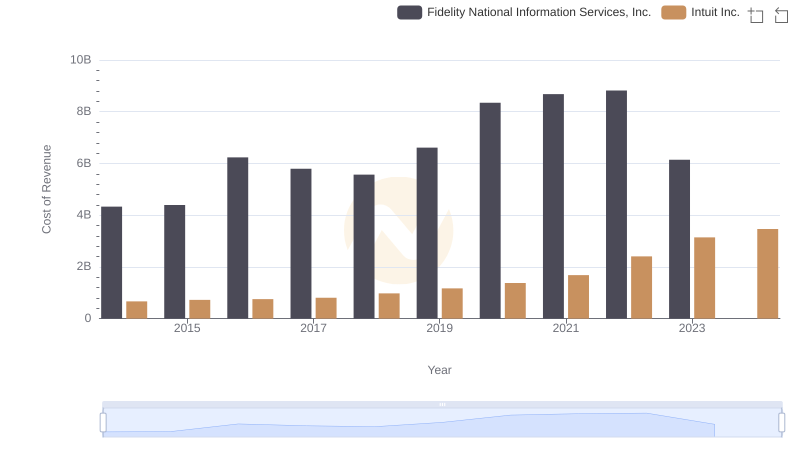
Intuit Inc. vs Fidelity National Information Services, Inc.: Efficiency in Cost of Revenue Explored
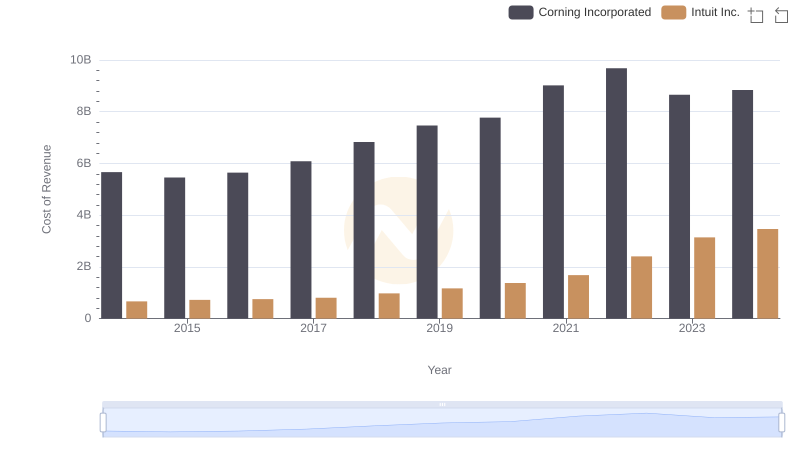
Cost of Revenue Trends: Intuit Inc. vs Corning Incorporated
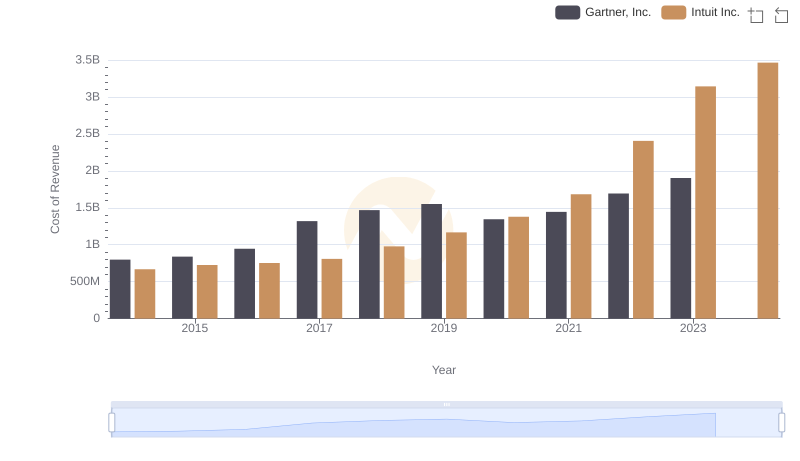
Intuit Inc. vs Gartner, Inc.: Efficiency in Cost of Revenue Explored
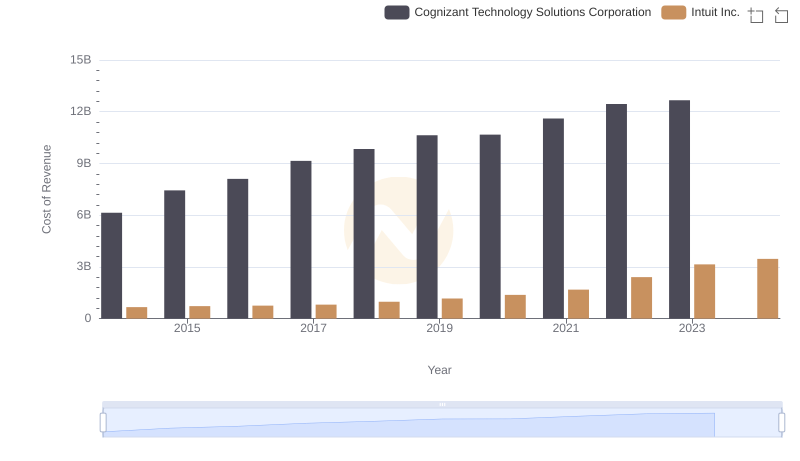
Cost Insights: Breaking Down Intuit Inc. and Cognizant Technology Solutions Corporation's Expenses
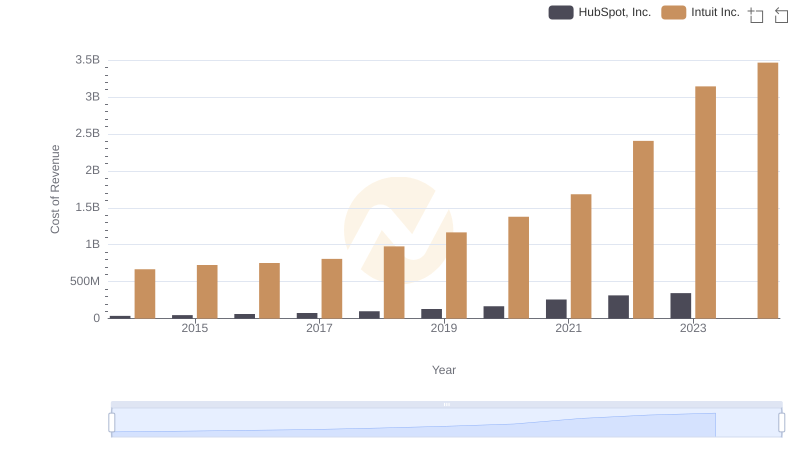
Comparing Cost of Revenue Efficiency: Intuit Inc. vs HubSpot, Inc.
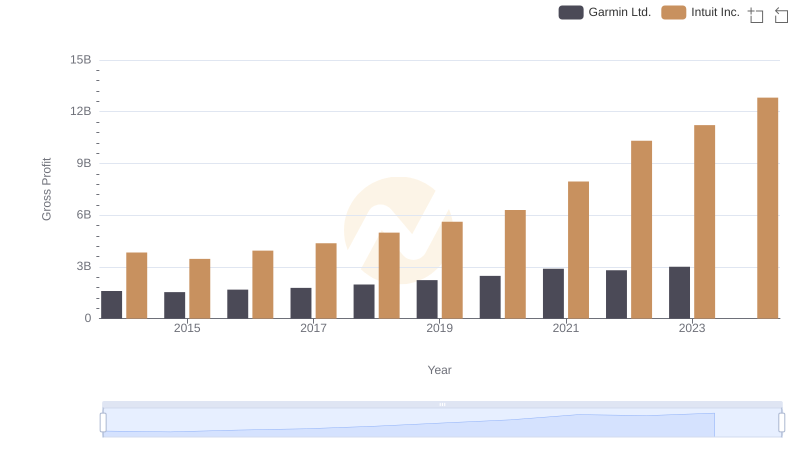
Intuit Inc. vs Garmin Ltd.: A Gross Profit Performance Breakdown
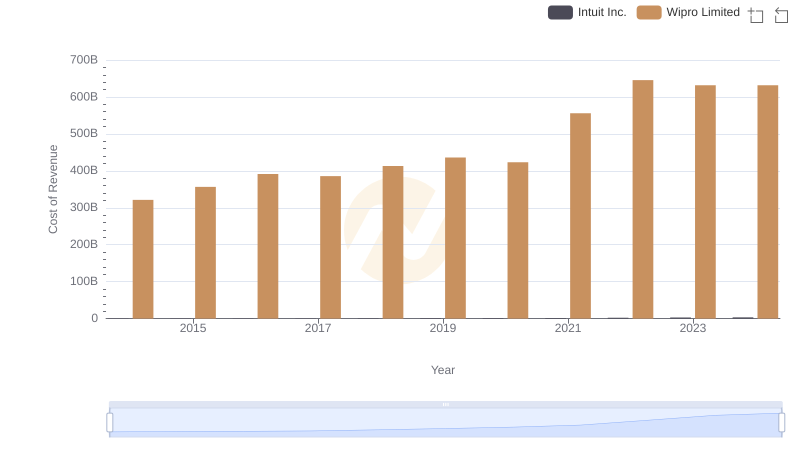
Cost of Revenue: Key Insights for Intuit Inc. and Wipro Limited
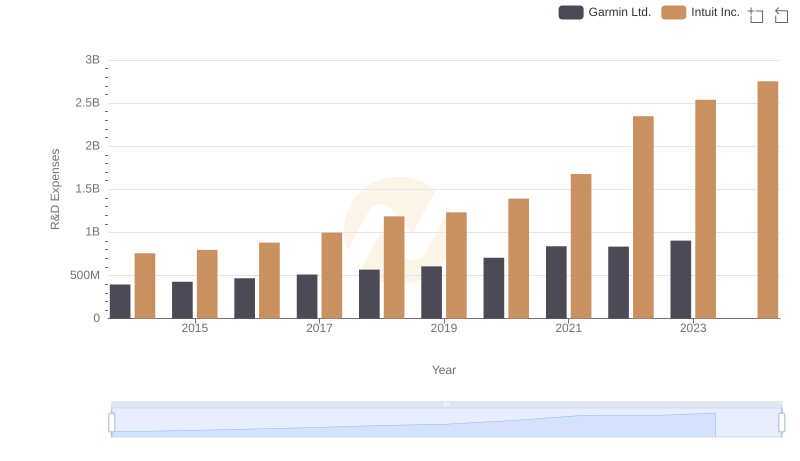
Intuit Inc. vs Garmin Ltd.: Strategic Focus on R&D Spending
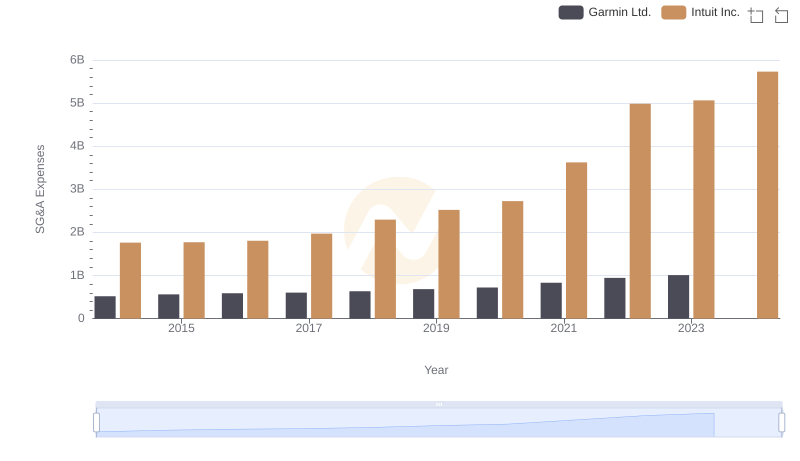
Who Optimizes SG&A Costs Better? Intuit Inc. or Garmin Ltd.
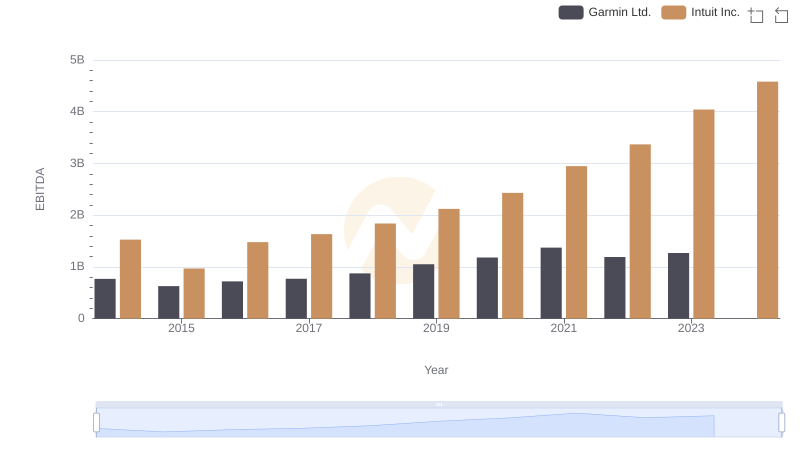
Intuit Inc. vs Garmin Ltd.: In-Depth EBITDA Performance Comparison