| __timestamp | Gartner, Inc. | Intuit Inc. |
|---|---|---|
| Wednesday, January 1, 2014 | 797933000 | 668000000 |
| Thursday, January 1, 2015 | 839076000 | 725000000 |
| Friday, January 1, 2016 | 945648000 | 752000000 |
| Sunday, January 1, 2017 | 1320198000 | 809000000 |
| Monday, January 1, 2018 | 1468800000 | 977000000 |
| Tuesday, January 1, 2019 | 1550568000 | 1167000000 |
| Wednesday, January 1, 2020 | 1345096000 | 1378000000 |
| Friday, January 1, 2021 | 1444106000 | 1683000000 |
| Saturday, January 1, 2022 | 1693805000 | 2406000000 |
| Sunday, January 1, 2023 | 1903240000 | 3143000000 |
| Monday, January 1, 2024 | 0 | 3465000000 |
Unlocking the unknown
In the ever-evolving landscape of technology and research, Intuit Inc. and Gartner, Inc. have been pivotal players. Over the past decade, from 2014 to 2023, these companies have demonstrated distinct trajectories in managing their cost of revenue. Intuit Inc. has shown a remarkable increase, with its cost of revenue growing by approximately 370% from 2014 to 2023. In contrast, Gartner, Inc. experienced a more modest rise of about 140% over the same period.
While both companies have expanded their operations, Intuit's aggressive growth strategy is evident in its cost structure, particularly in recent years. By 2023, Intuit's cost of revenue was nearly 65% higher than Gartner's, highlighting its expansive approach. However, the data for 2024 is incomplete, leaving room for speculation on future trends. This analysis underscores the dynamic nature of the tech industry and the strategic decisions that shape its leaders.
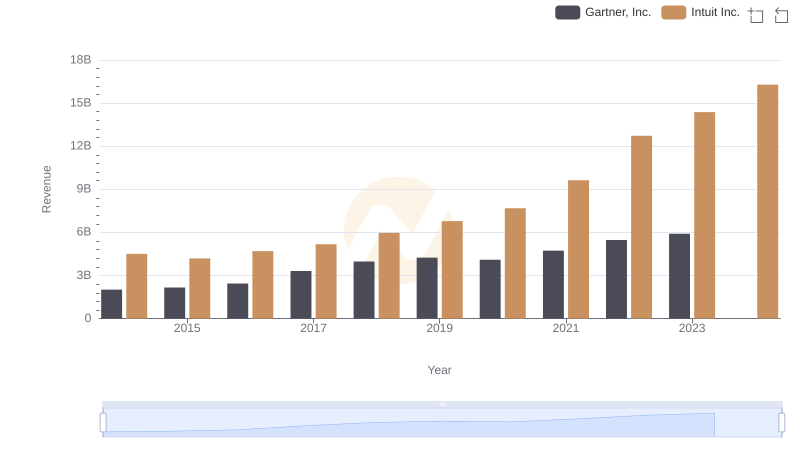
Intuit Inc. and Gartner, Inc.: A Comprehensive Revenue Analysis
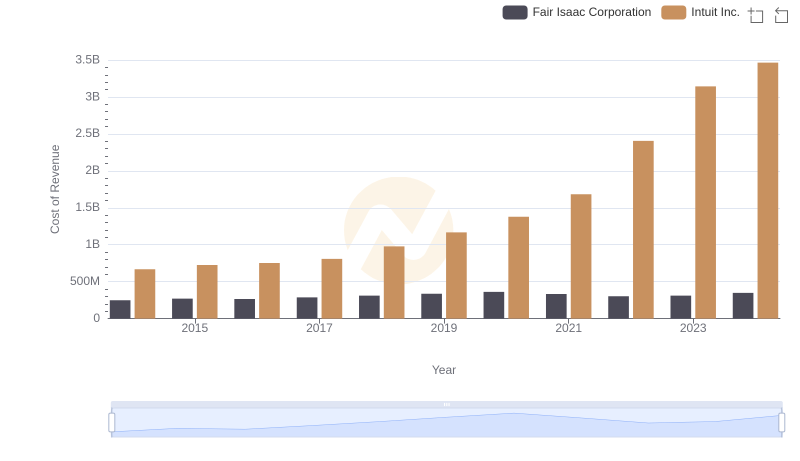
Cost of Revenue Comparison: Intuit Inc. vs Fair Isaac Corporation
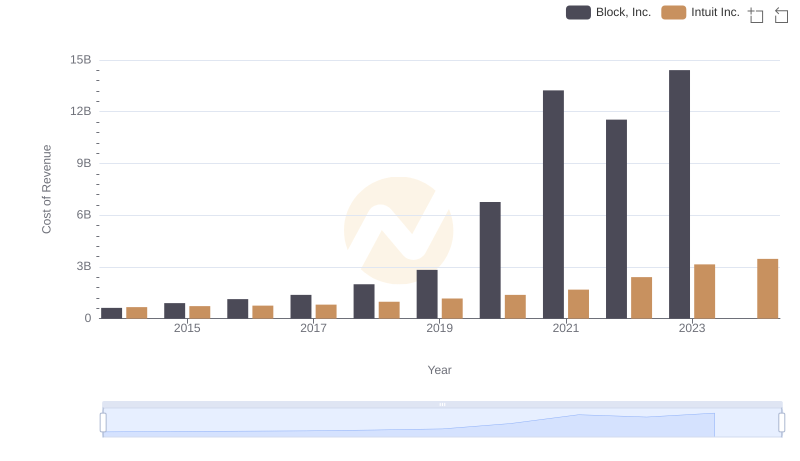
Cost Insights: Breaking Down Intuit Inc. and Block, Inc.'s Expenses
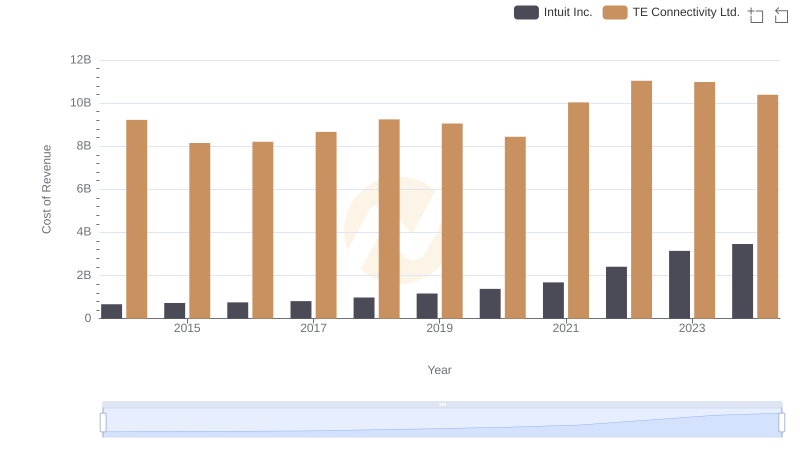
Cost of Revenue: Key Insights for Intuit Inc. and TE Connectivity Ltd.
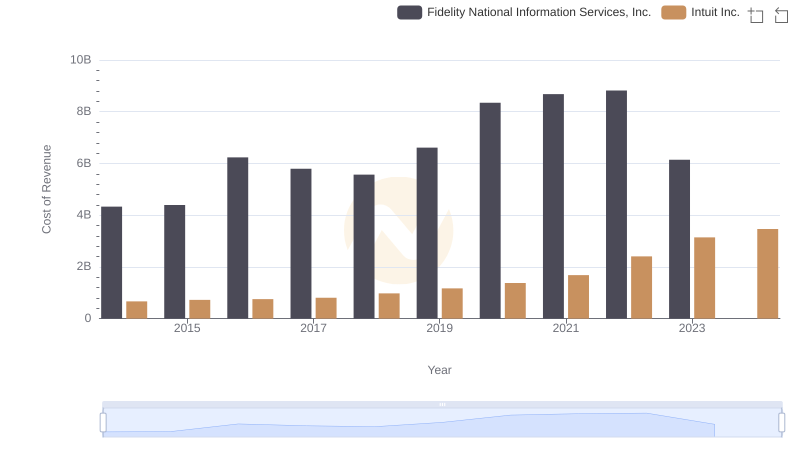
Intuit Inc. vs Fidelity National Information Services, Inc.: Efficiency in Cost of Revenue Explored
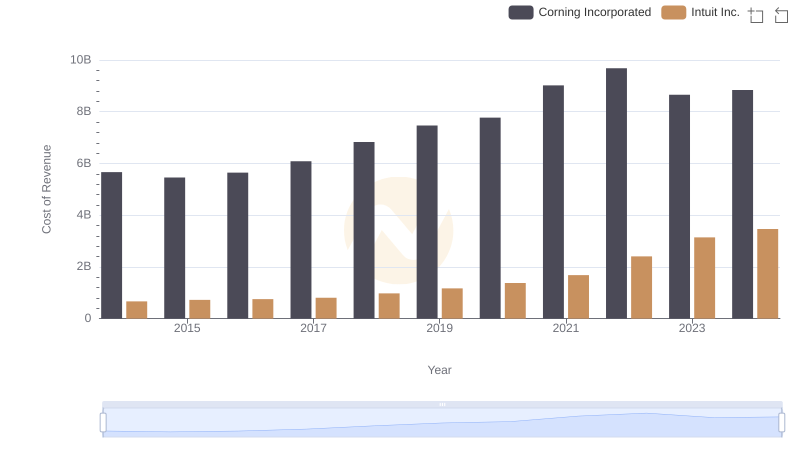
Cost of Revenue Trends: Intuit Inc. vs Corning Incorporated
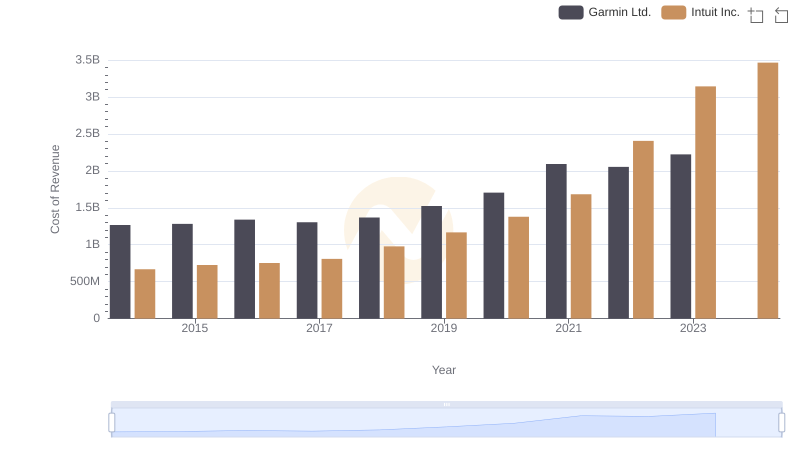
Cost of Revenue Comparison: Intuit Inc. vs Garmin Ltd.
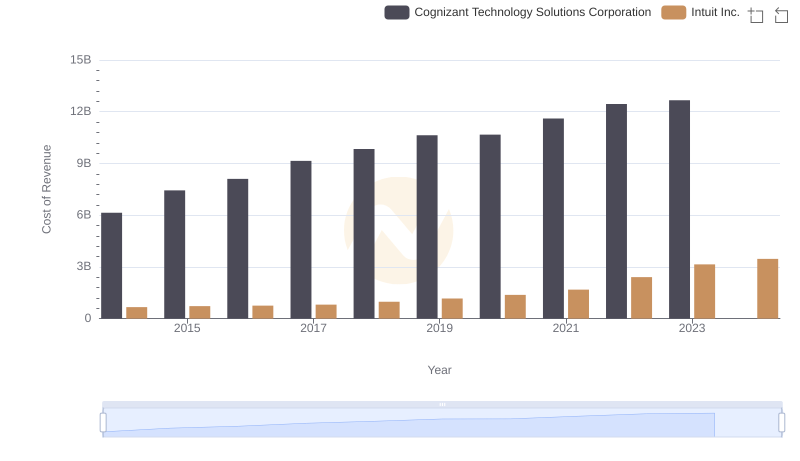
Cost Insights: Breaking Down Intuit Inc. and Cognizant Technology Solutions Corporation's Expenses
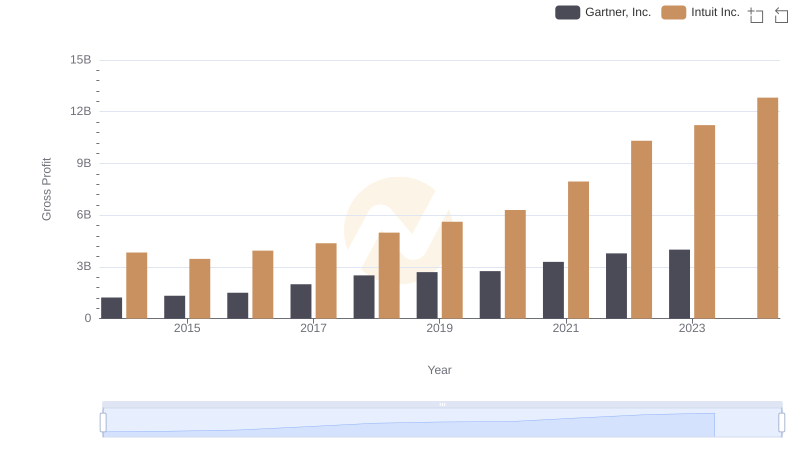
Who Generates Higher Gross Profit? Intuit Inc. or Gartner, Inc.
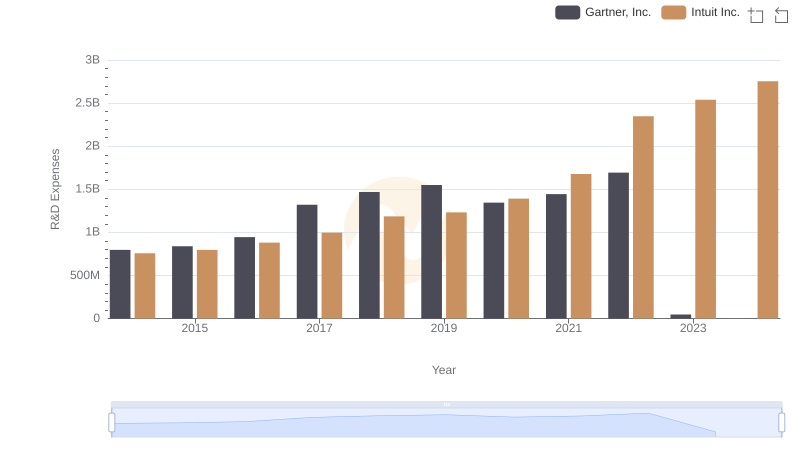
Intuit Inc. vs Gartner, Inc.: Strategic Focus on R&D Spending
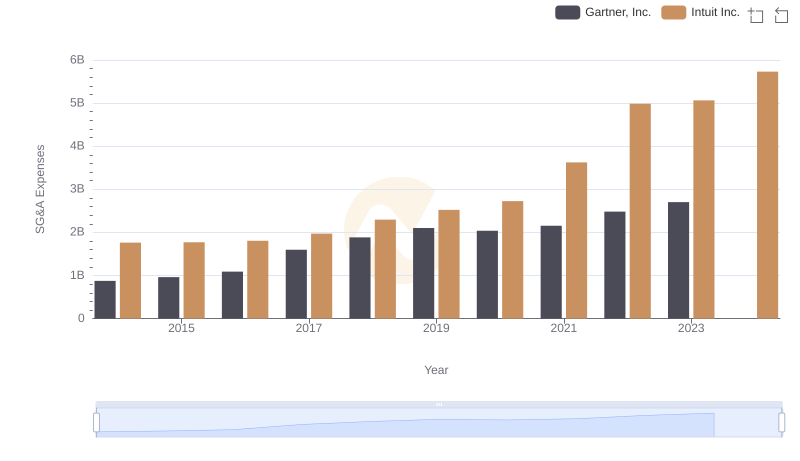
Intuit Inc. vs Gartner, Inc.: SG&A Expense Trends
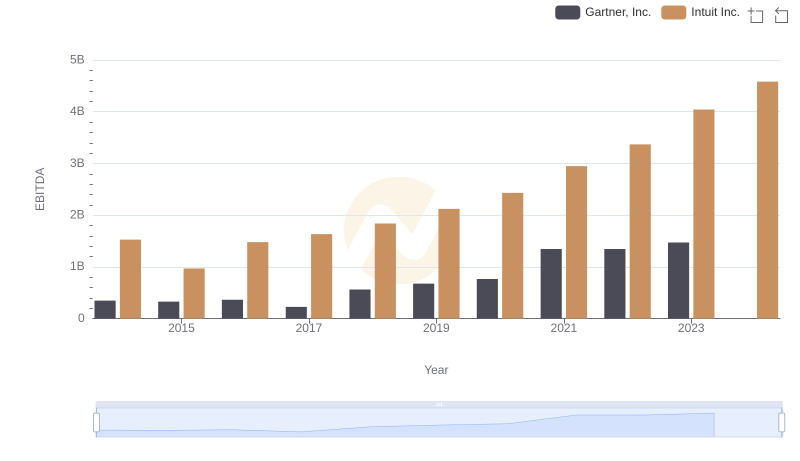
A Professional Review of EBITDA: Intuit Inc. Compared to Gartner, Inc.