| __timestamp | AerCap Holdings N.V. | United Rentals, Inc. |
|---|---|---|
| Wednesday, January 1, 2014 | 2252878000 | 3253000000 |
| Thursday, January 1, 2015 | 3776407000 | 3337000000 |
| Friday, January 1, 2016 | 3465727000 | 3359000000 |
| Sunday, January 1, 2017 | 3377439000 | 3872000000 |
| Monday, January 1, 2018 | 3299635000 | 4683000000 |
| Tuesday, January 1, 2019 | 3259091000 | 5681000000 |
| Wednesday, January 1, 2020 | 3217133000 | 5347000000 |
| Friday, January 1, 2021 | 3287413000 | 5863000000 |
| Saturday, January 1, 2022 | 4805277000 | 6646000000 |
| Sunday, January 1, 2023 | 3237016000 | 8519000000 |
| Monday, January 1, 2024 | 9195000000 |
Unleashing insights
In the ever-evolving landscape of corporate finance, understanding cost structures is crucial. This analysis delves into the cost of revenue trends for United Rentals, Inc. and AerCap Holdings N.V. from 2014 to 2023. Over this period, United Rentals, Inc. has seen a significant increase in its cost of revenue, rising by approximately 180%, from $3.25 billion in 2014 to $8.52 billion in 2023. This growth reflects the company's expanding operations and market reach. In contrast, AerCap Holdings N.V. experienced a more modest increase of around 44%, with costs peaking in 2022 at $4.81 billion before dropping to $3.24 billion in 2023. The data for 2024 is incomplete, highlighting the dynamic nature of financial reporting. These insights provide a window into the strategic financial maneuvers of these industry giants, offering valuable lessons for investors and analysts alike.
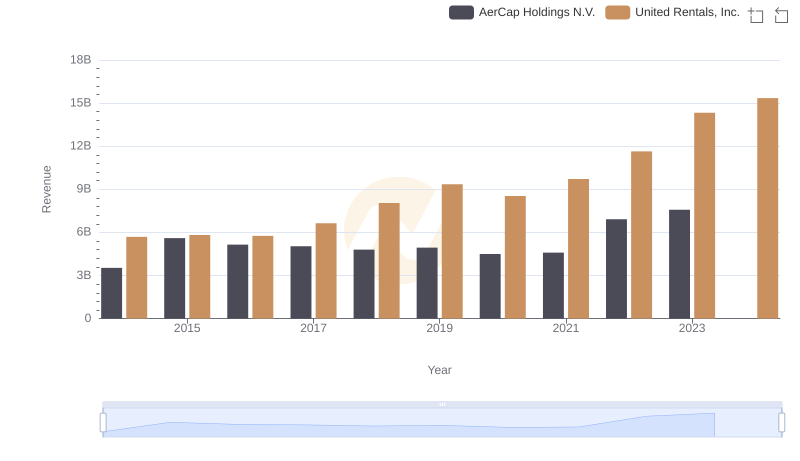
United Rentals, Inc. vs AerCap Holdings N.V.: Annual Revenue Growth Compared
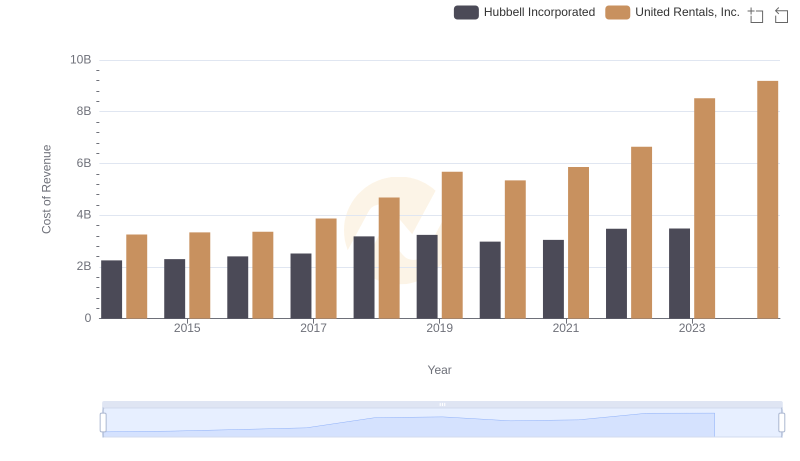
Comparing Cost of Revenue Efficiency: United Rentals, Inc. vs Hubbell Incorporated
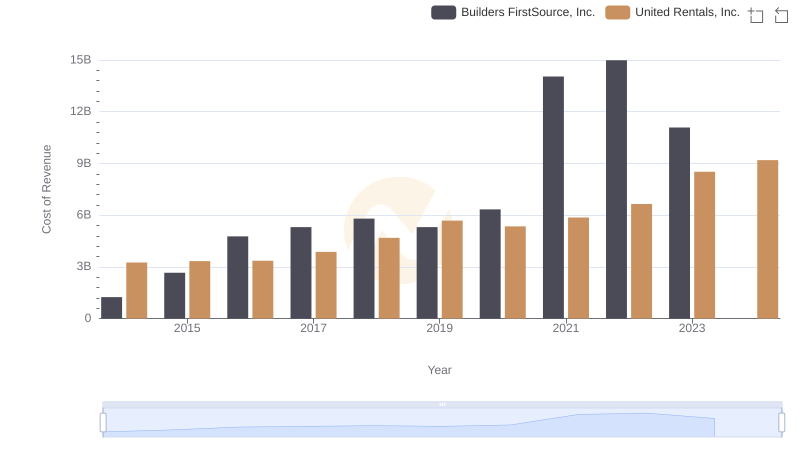
Cost Insights: Breaking Down United Rentals, Inc. and Builders FirstSource, Inc.'s Expenses
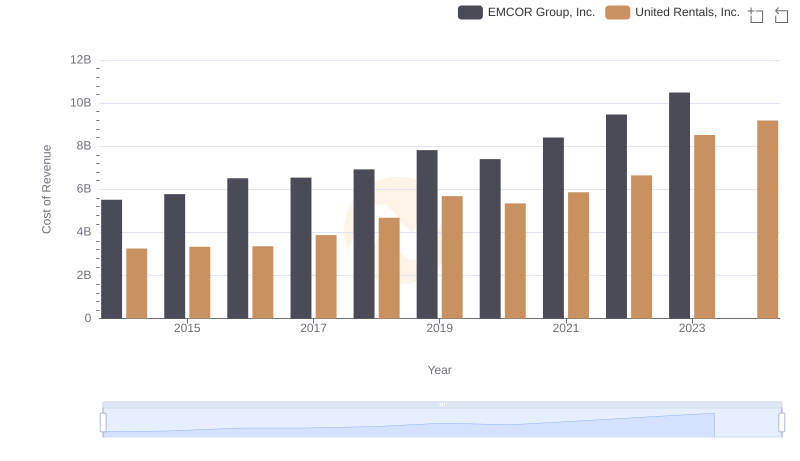
United Rentals, Inc. vs EMCOR Group, Inc.: Efficiency in Cost of Revenue Explored
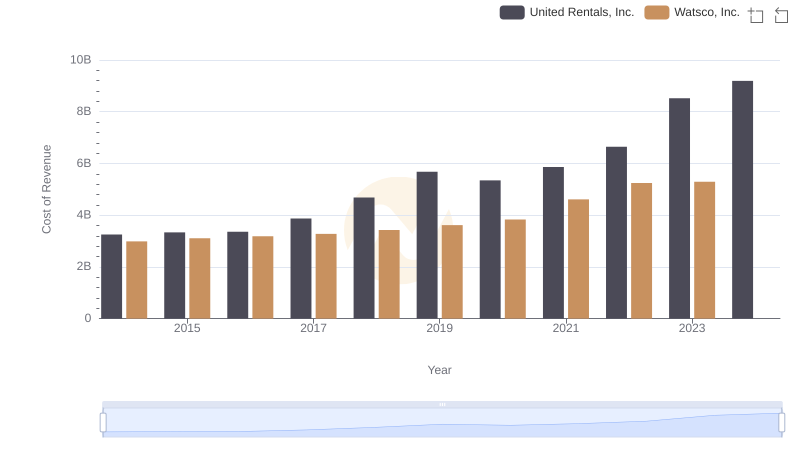
United Rentals, Inc. vs Watsco, Inc.: Efficiency in Cost of Revenue Explored
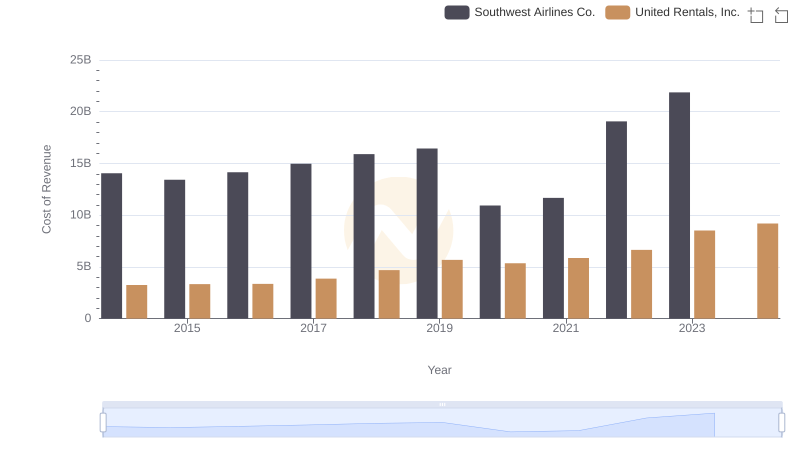
Cost Insights: Breaking Down United Rentals, Inc. and Southwest Airlines Co.'s Expenses
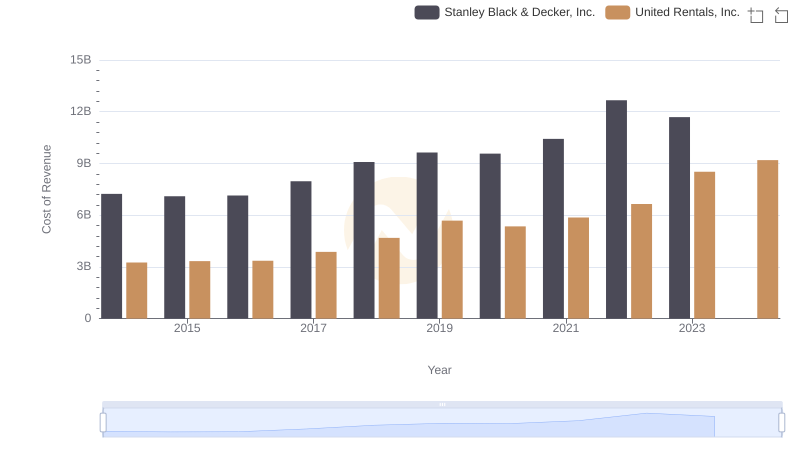
Cost of Revenue Comparison: United Rentals, Inc. vs Stanley Black & Decker, Inc.
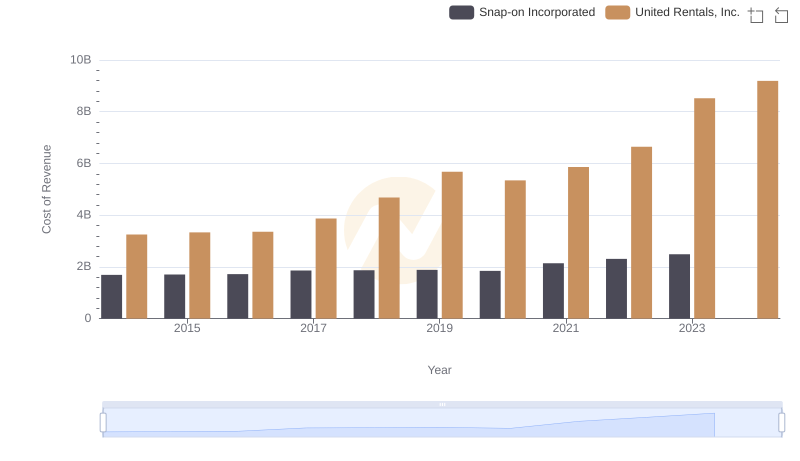
Cost Insights: Breaking Down United Rentals, Inc. and Snap-on Incorporated's Expenses
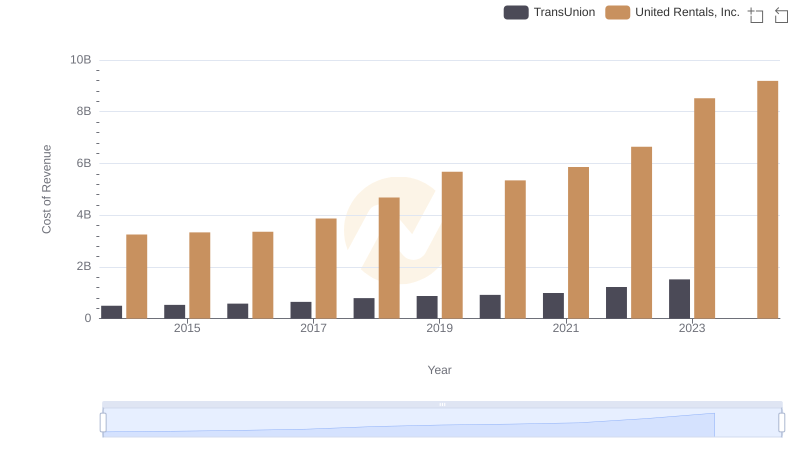
Cost of Revenue: Key Insights for United Rentals, Inc. and TransUnion
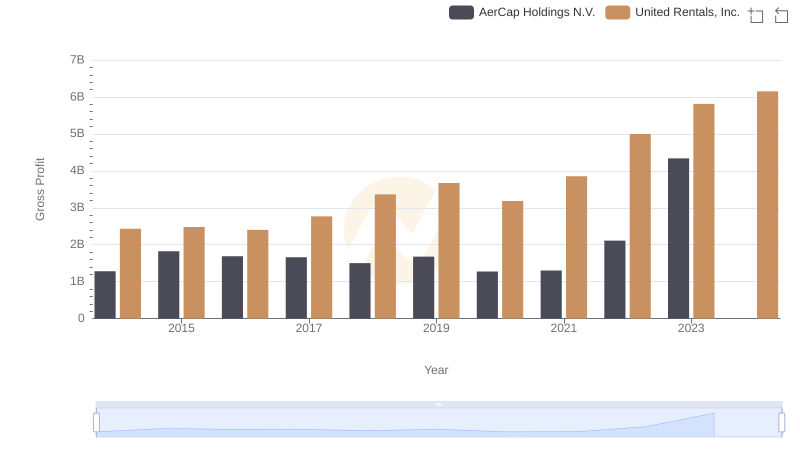
Gross Profit Analysis: Comparing United Rentals, Inc. and AerCap Holdings N.V.
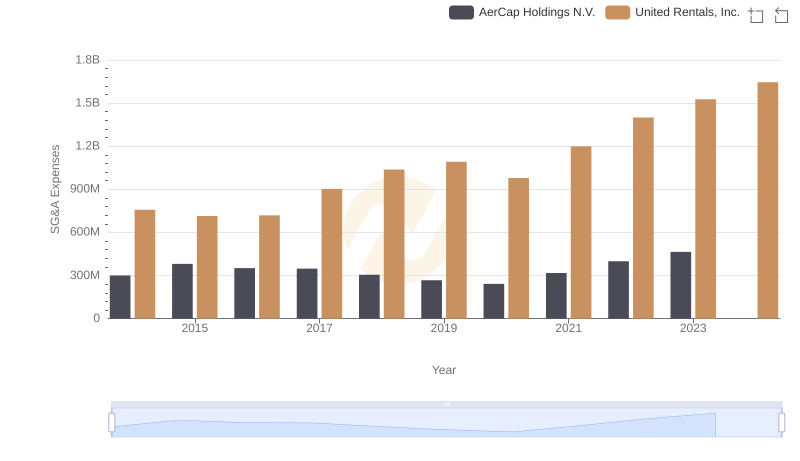
Cost Management Insights: SG&A Expenses for United Rentals, Inc. and AerCap Holdings N.V.
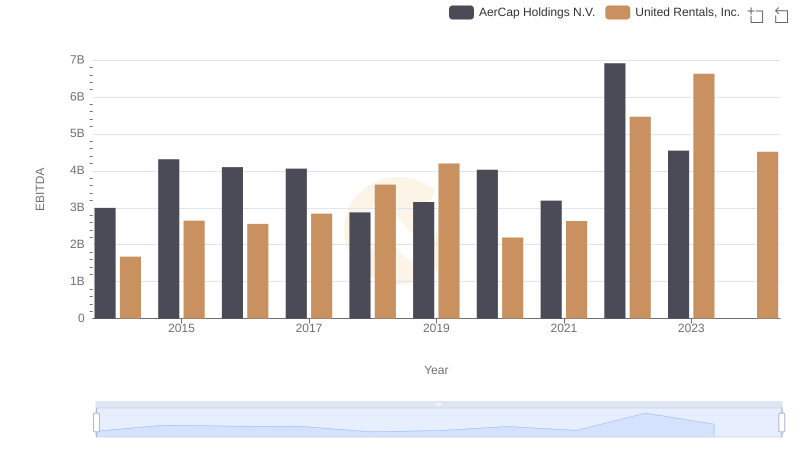
Comparative EBITDA Analysis: United Rentals, Inc. vs AerCap Holdings N.V.