| __timestamp | United Rentals, Inc. | Watsco, Inc. |
|---|---|---|
| Wednesday, January 1, 2014 | 3253000000 | 2988138000 |
| Thursday, January 1, 2015 | 3337000000 | 3105882000 |
| Friday, January 1, 2016 | 3359000000 | 3186118000 |
| Sunday, January 1, 2017 | 3872000000 | 3276296000 |
| Monday, January 1, 2018 | 4683000000 | 3426401000 |
| Tuesday, January 1, 2019 | 5681000000 | 3613406000 |
| Wednesday, January 1, 2020 | 5347000000 | 3832107000 |
| Friday, January 1, 2021 | 5863000000 | 4612647000 |
| Saturday, January 1, 2022 | 6646000000 | 5244055000 |
| Sunday, January 1, 2023 | 8519000000 | 5291627000 |
| Monday, January 1, 2024 | 9195000000 | 5573604000 |
Unleashing insights
In the competitive landscape of industrial services, cost efficiency is paramount. United Rentals, Inc. and Watsco, Inc. have been pivotal players in this arena. From 2014 to 2023, United Rentals demonstrated a robust growth trajectory, with its cost of revenue surging by approximately 183%, from $3.25 billion to $9.19 billion. This reflects a strategic expansion and scaling of operations. In contrast, Watsco, Inc. exhibited a steadier growth, with a 77% increase in cost of revenue, peaking at $5.29 billion in 2023. Notably, data for 2024 is missing for Watsco, indicating potential reporting delays or strategic shifts. This comparison underscores United Rentals' aggressive market positioning, while Watsco maintains a more conservative approach. As the industry evolves, these trends offer valuable insights into the operational strategies of these giants.
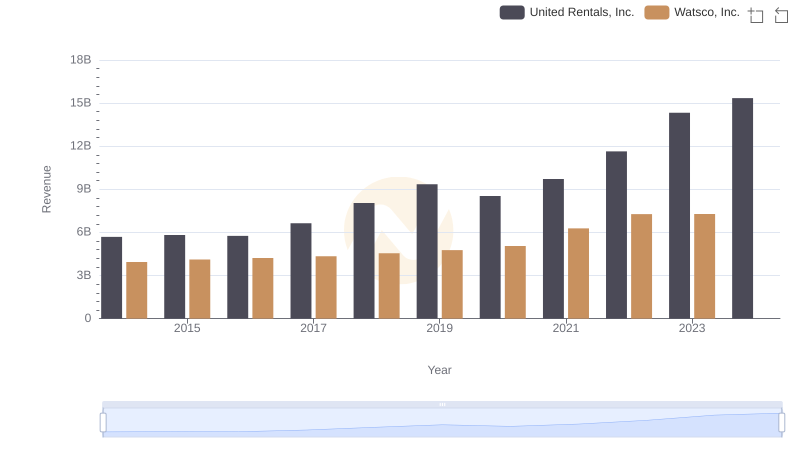
United Rentals, Inc. or Watsco, Inc.: Who Leads in Yearly Revenue?
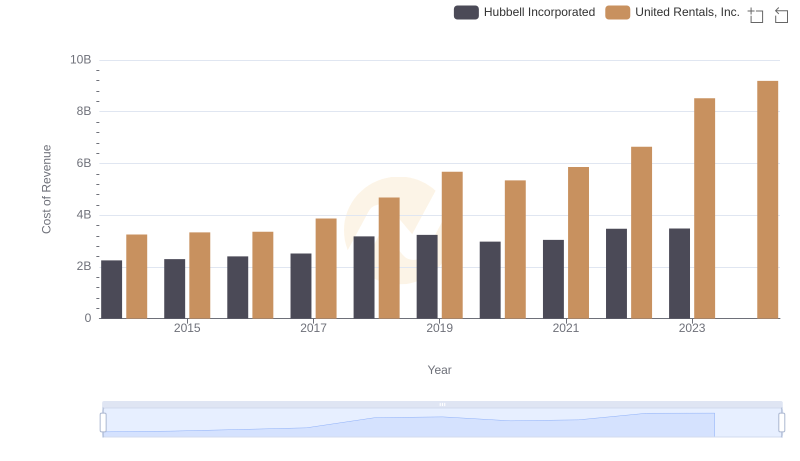
Comparing Cost of Revenue Efficiency: United Rentals, Inc. vs Hubbell Incorporated
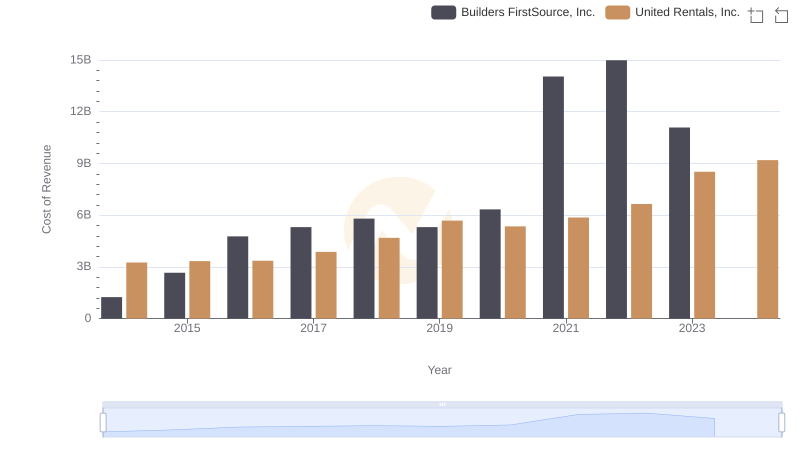
Cost Insights: Breaking Down United Rentals, Inc. and Builders FirstSource, Inc.'s Expenses
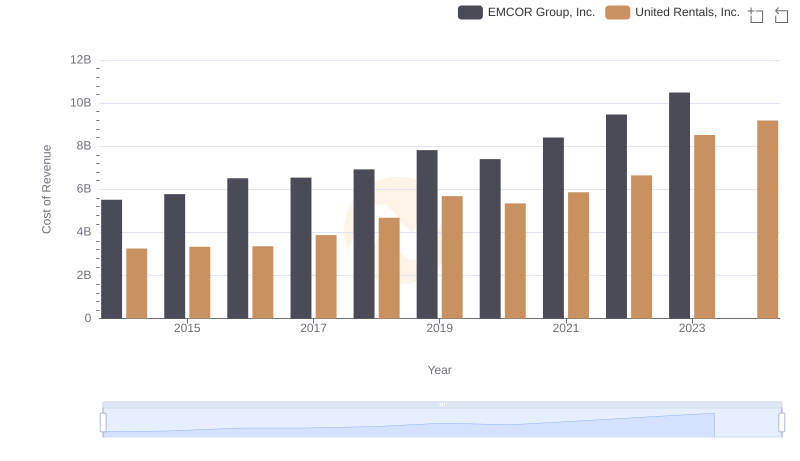
United Rentals, Inc. vs EMCOR Group, Inc.: Efficiency in Cost of Revenue Explored
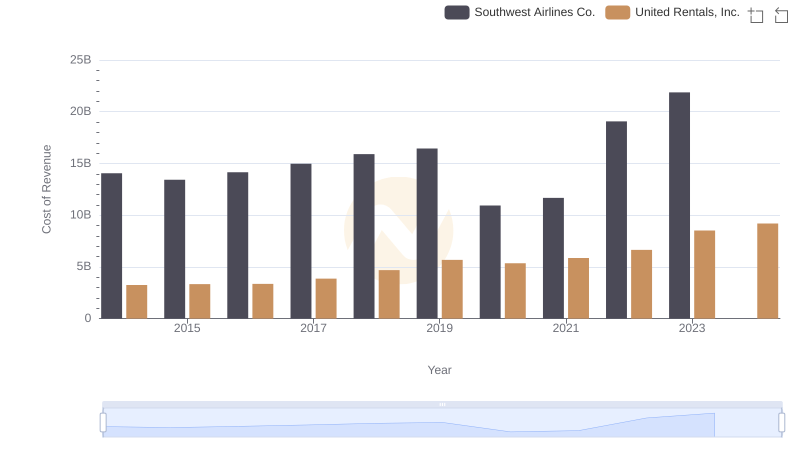
Cost Insights: Breaking Down United Rentals, Inc. and Southwest Airlines Co.'s Expenses
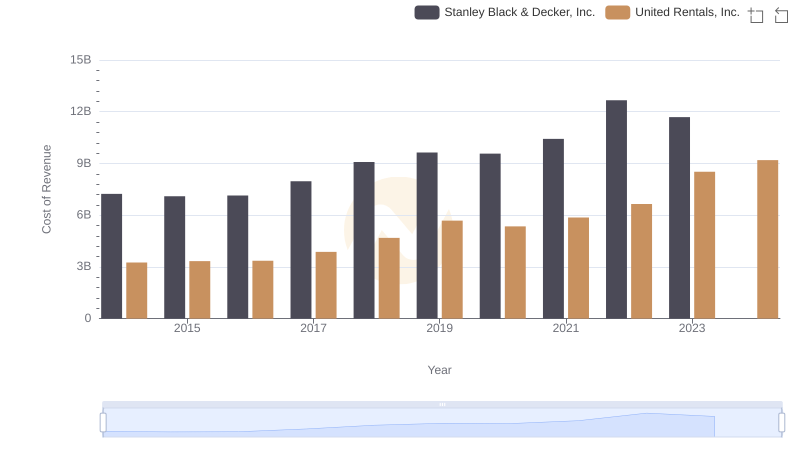
Cost of Revenue Comparison: United Rentals, Inc. vs Stanley Black & Decker, Inc.
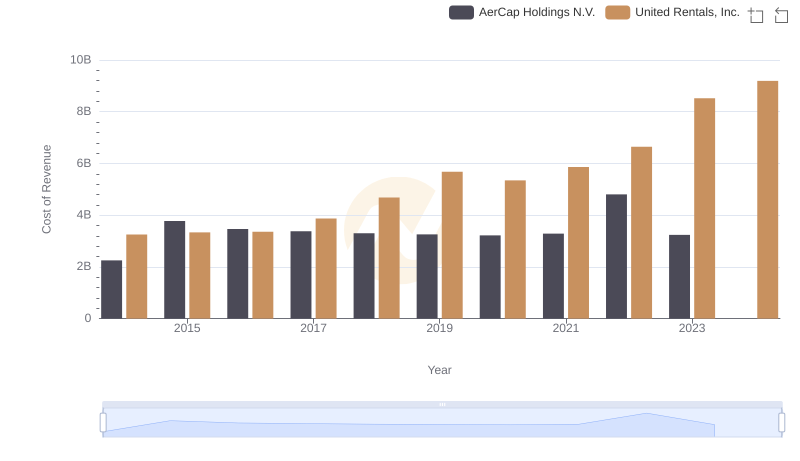
Cost Insights: Breaking Down United Rentals, Inc. and AerCap Holdings N.V.'s Expenses
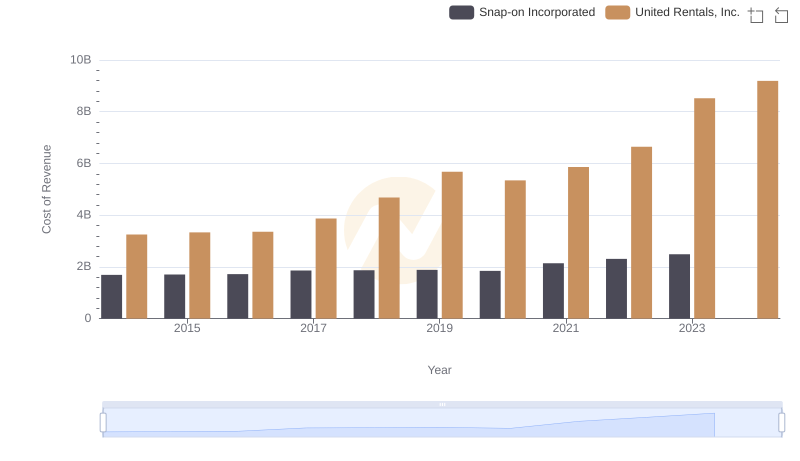
Cost Insights: Breaking Down United Rentals, Inc. and Snap-on Incorporated's Expenses
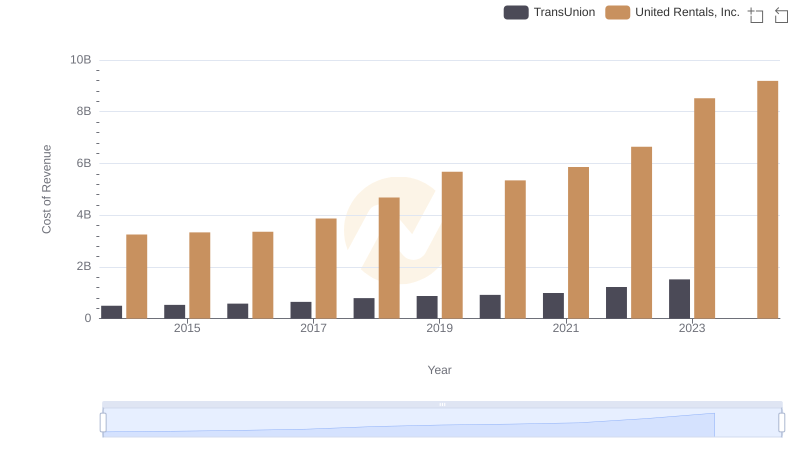
Cost of Revenue: Key Insights for United Rentals, Inc. and TransUnion
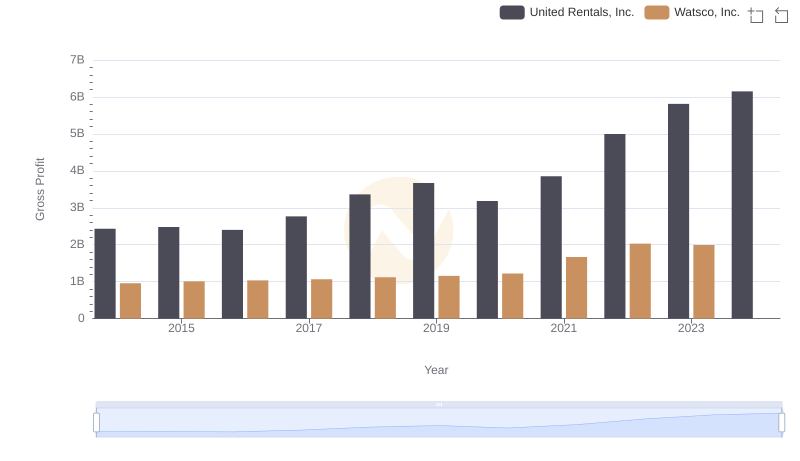
Gross Profit Analysis: Comparing United Rentals, Inc. and Watsco, Inc.
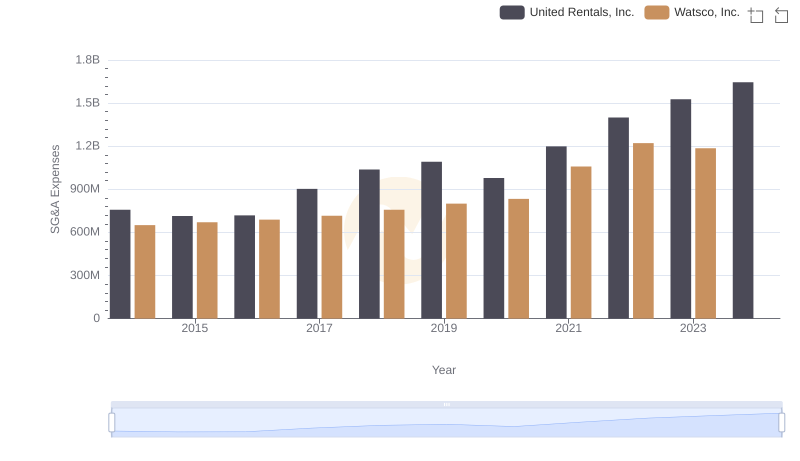
Cost Management Insights: SG&A Expenses for United Rentals, Inc. and Watsco, Inc.
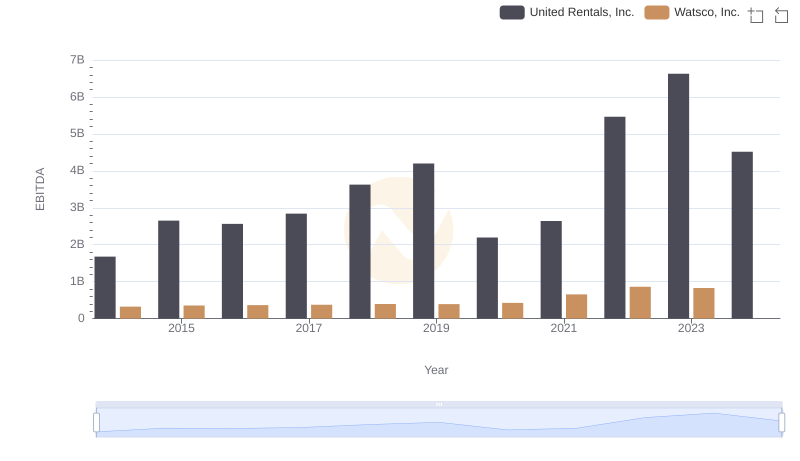
EBITDA Analysis: Evaluating United Rentals, Inc. Against Watsco, Inc.