| __timestamp | Southwest Airlines Co. | United Rentals, Inc. |
|---|---|---|
| Wednesday, January 1, 2014 | 14049000000 | 3253000000 |
| Thursday, January 1, 2015 | 13423000000 | 3337000000 |
| Friday, January 1, 2016 | 14151000000 | 3359000000 |
| Sunday, January 1, 2017 | 14968000000 | 3872000000 |
| Monday, January 1, 2018 | 15907000000 | 4683000000 |
| Tuesday, January 1, 2019 | 16445000000 | 5681000000 |
| Wednesday, January 1, 2020 | 10938000000 | 5347000000 |
| Friday, January 1, 2021 | 11675000000 | 5863000000 |
| Saturday, January 1, 2022 | 19062000000 | 6646000000 |
| Sunday, January 1, 2023 | 21868000000 | 8519000000 |
| Monday, January 1, 2024 | 23024000000 | 9195000000 |
Unleashing insights
In the ever-evolving landscape of corporate expenses, understanding cost structures is crucial for investors and stakeholders. This analysis delves into the cost of revenue trends for United Rentals, Inc. and Southwest Airlines Co. over the past decade. From 2014 to 2023, Southwest Airlines experienced a 56% increase in its cost of revenue, peaking in 2023. Meanwhile, United Rentals saw a nearly threefold rise, highlighting its aggressive expansion strategy. Notably, 2020 marked a dip for Southwest Airlines, likely due to the pandemic's impact on travel, while United Rentals maintained steady growth. The absence of data for Southwest Airlines in 2024 suggests a need for further investigation. This comparative insight not only sheds light on the financial health of these giants but also offers a glimpse into their strategic priorities.
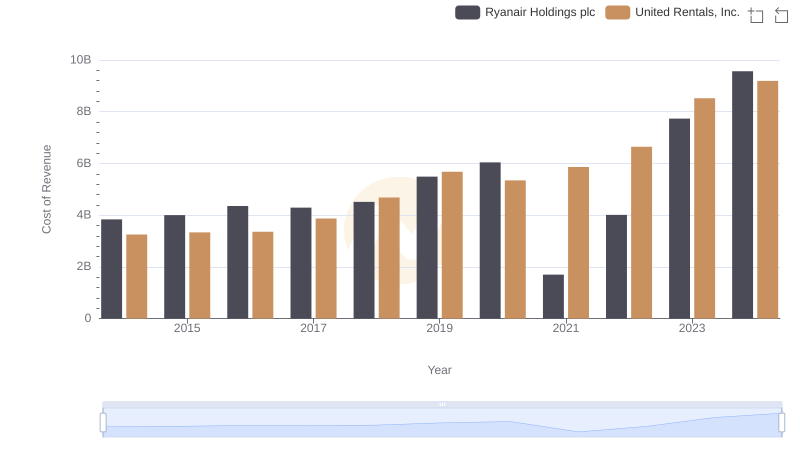
Cost Insights: Breaking Down United Rentals, Inc. and Ryanair Holdings plc's Expenses
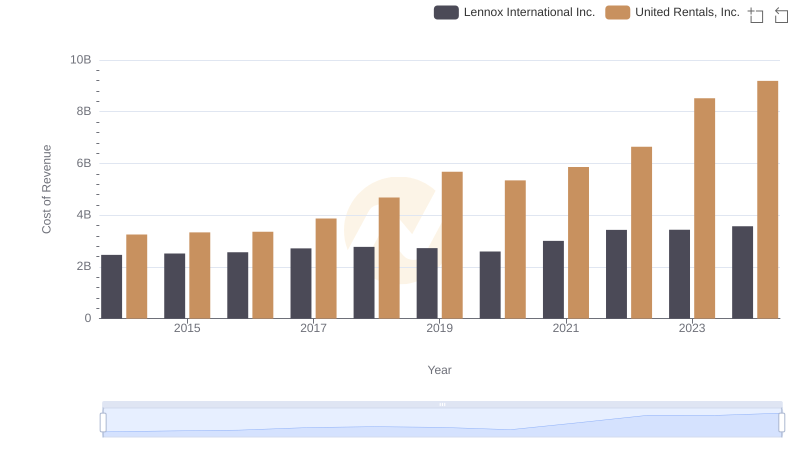
Cost of Revenue Trends: United Rentals, Inc. vs Lennox International Inc.
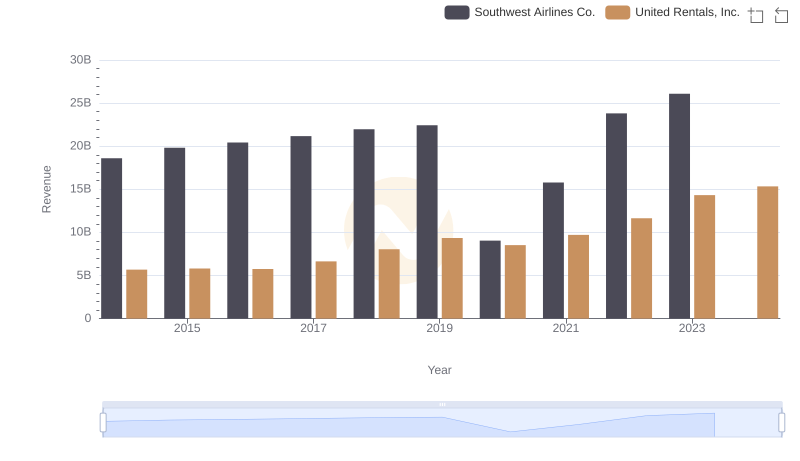
Comparing Revenue Performance: United Rentals, Inc. or Southwest Airlines Co.?
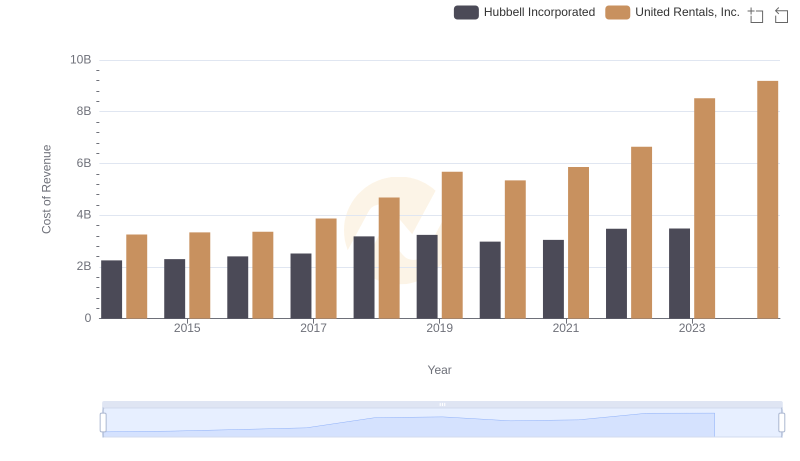
Comparing Cost of Revenue Efficiency: United Rentals, Inc. vs Hubbell Incorporated
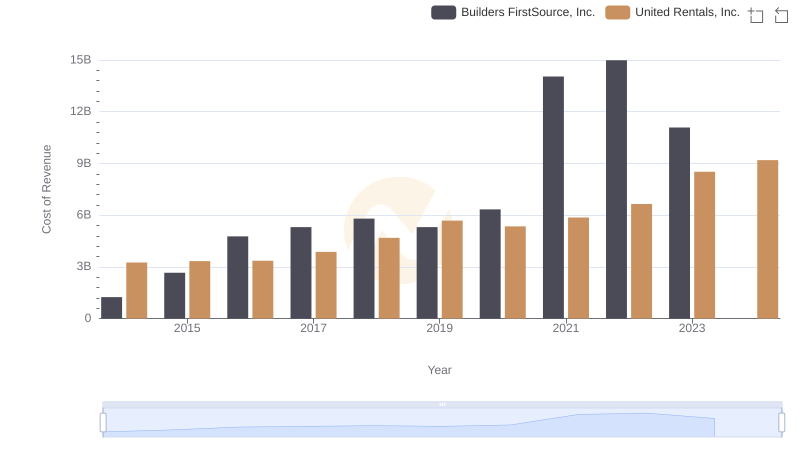
Cost Insights: Breaking Down United Rentals, Inc. and Builders FirstSource, Inc.'s Expenses
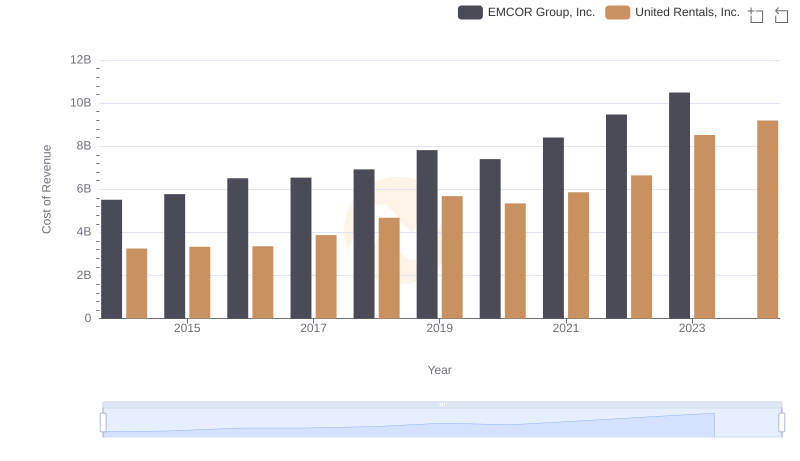
United Rentals, Inc. vs EMCOR Group, Inc.: Efficiency in Cost of Revenue Explored
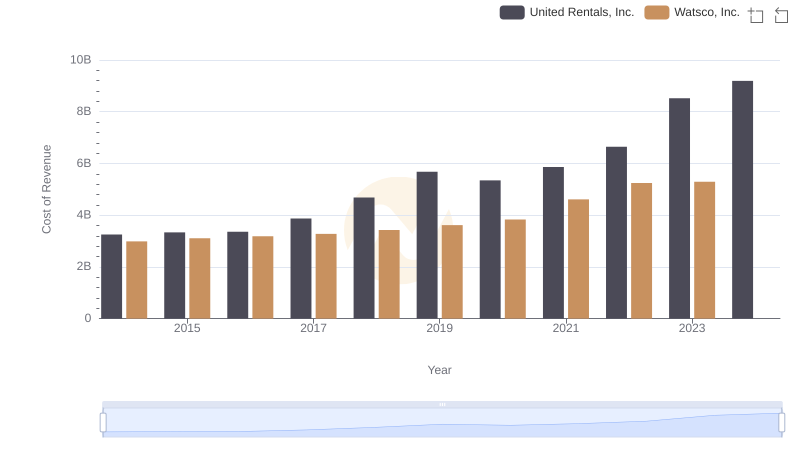
United Rentals, Inc. vs Watsco, Inc.: Efficiency in Cost of Revenue Explored
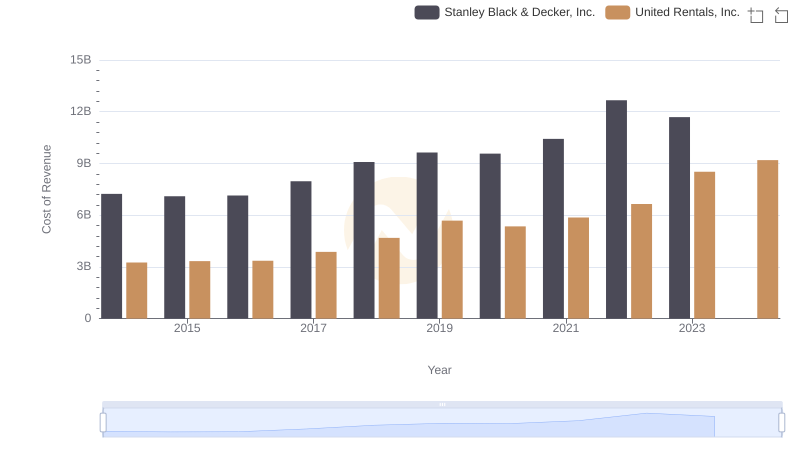
Cost of Revenue Comparison: United Rentals, Inc. vs Stanley Black & Decker, Inc.
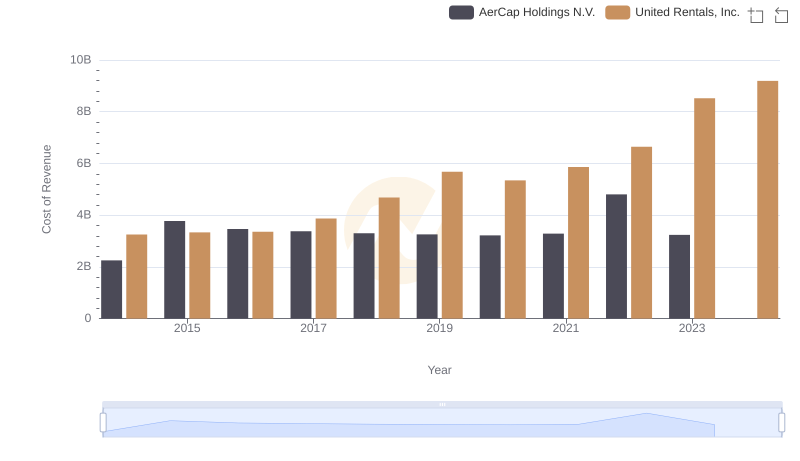
Cost Insights: Breaking Down United Rentals, Inc. and AerCap Holdings N.V.'s Expenses
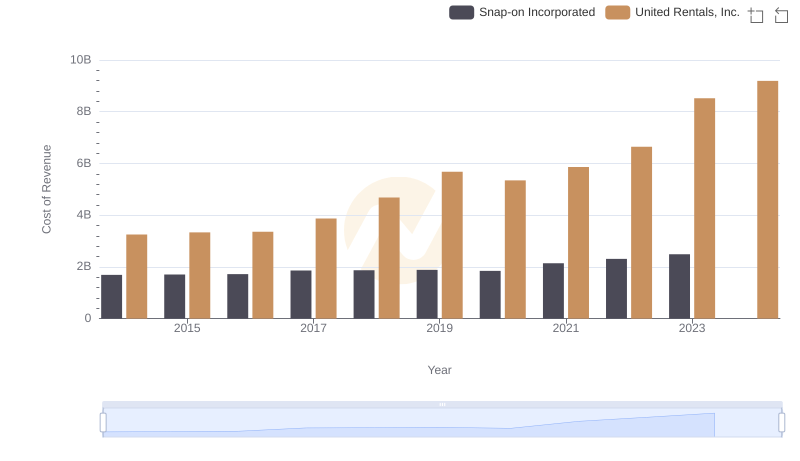
Cost Insights: Breaking Down United Rentals, Inc. and Snap-on Incorporated's Expenses
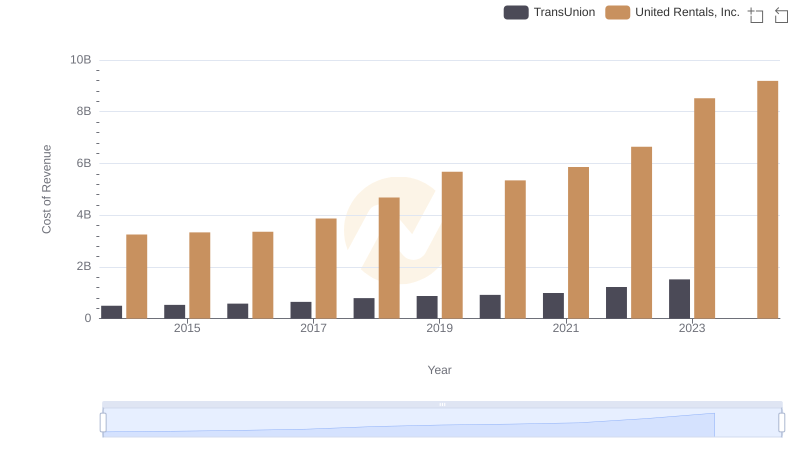
Cost of Revenue: Key Insights for United Rentals, Inc. and TransUnion
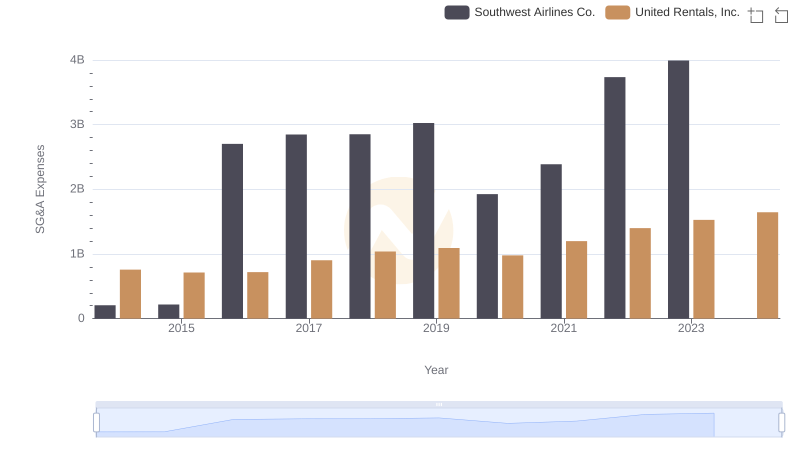
Cost Management Insights: SG&A Expenses for United Rentals, Inc. and Southwest Airlines Co.