| __timestamp | ASE Technology Holding Co., Ltd. | Intuit Inc. |
|---|---|---|
| Wednesday, January 1, 2014 | 203051000000 | 668000000 |
| Thursday, January 1, 2015 | 233153000000 | 725000000 |
| Friday, January 1, 2016 | 221690000000 | 752000000 |
| Sunday, January 1, 2017 | 237709000000 | 809000000 |
| Monday, January 1, 2018 | 309929000000 | 977000000 |
| Tuesday, January 1, 2019 | 348871000000 | 1167000000 |
| Wednesday, January 1, 2020 | 398994000000 | 1378000000 |
| Friday, January 1, 2021 | 459628000000 | 1683000000 |
| Saturday, January 1, 2022 | 535943000000 | 2406000000 |
| Sunday, January 1, 2023 | 490157339000 | 3143000000 |
| Monday, January 1, 2024 | 499722880000 | 3465000000 |
In pursuit of knowledge
In the ever-evolving landscape of global business, understanding the cost of revenue is crucial for investors and analysts alike. This chart provides a fascinating comparison between Intuit Inc., a leader in financial software, and ASE Technology Holding Co., Ltd., a titan in semiconductor manufacturing.
From 2014 to 2023, ASE Technology's cost of revenue has shown a remarkable increase of approximately 141%, peaking in 2022. This growth reflects the company's expanding operations and market demand. In contrast, Intuit Inc. has experienced a steady rise of around 370% over the same period, highlighting its strategic investments and product innovations.
While 2024 data for ASE Technology is unavailable, Intuit's continued upward trend suggests a promising future. This comparison underscores the diverse strategies and market dynamics influencing these industry giants.
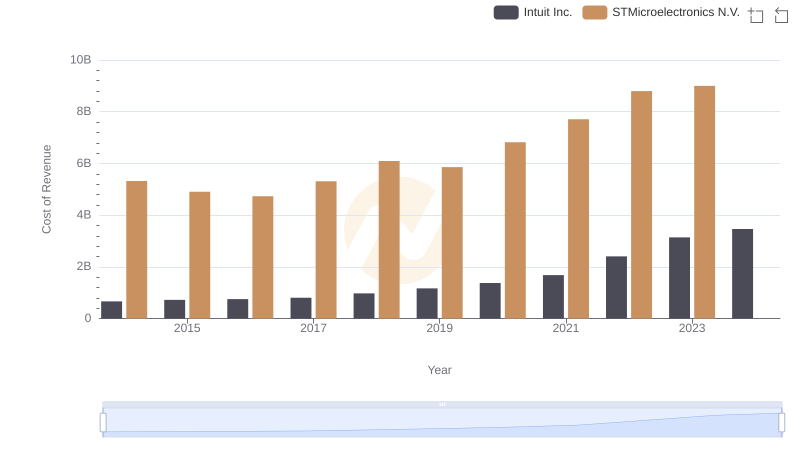
Cost Insights: Breaking Down Intuit Inc. and STMicroelectronics N.V.'s Expenses
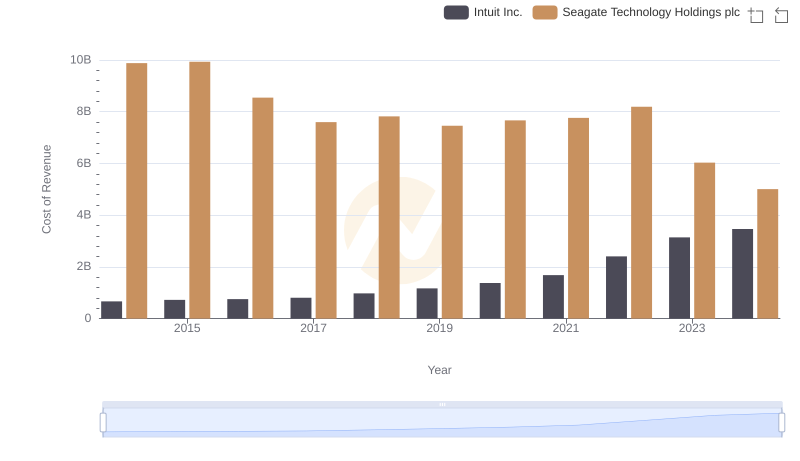
Cost Insights: Breaking Down Intuit Inc. and Seagate Technology Holdings plc's Expenses
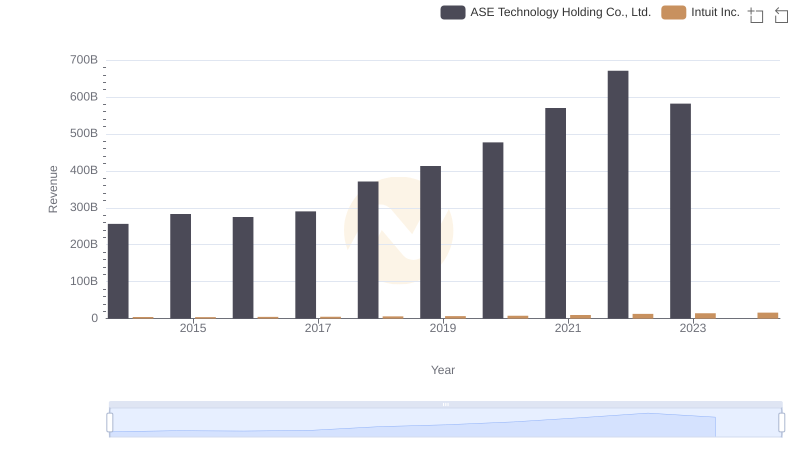
Annual Revenue Comparison: Intuit Inc. vs ASE Technology Holding Co., Ltd.
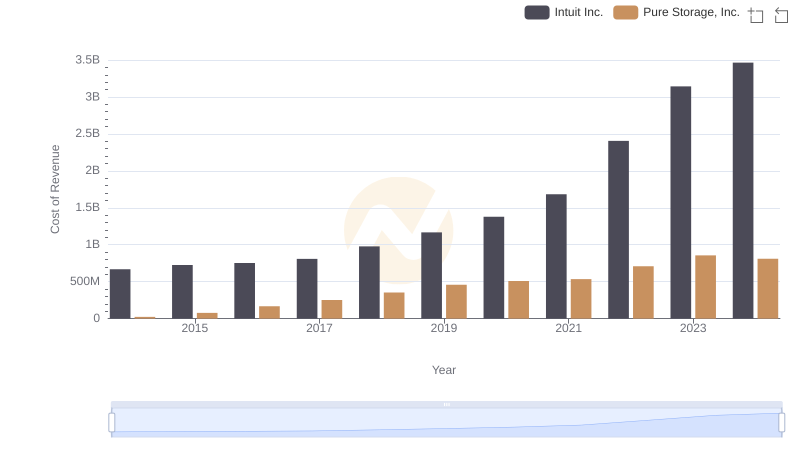
Analyzing Cost of Revenue: Intuit Inc. and Pure Storage, Inc.
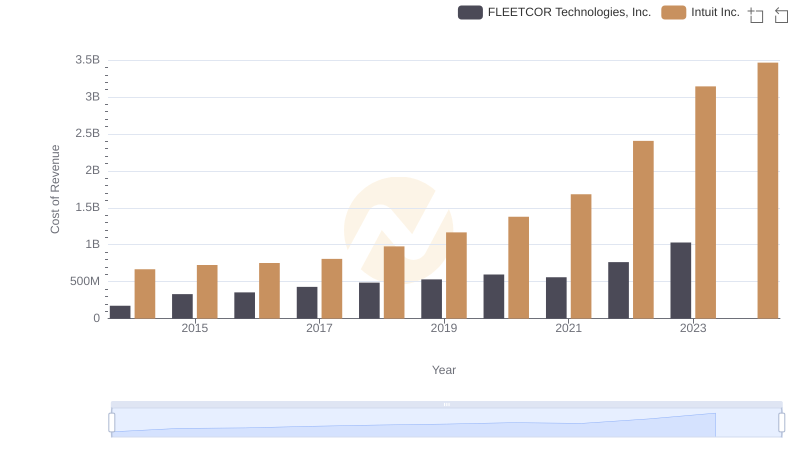
Comparing Cost of Revenue Efficiency: Intuit Inc. vs FLEETCOR Technologies, Inc.
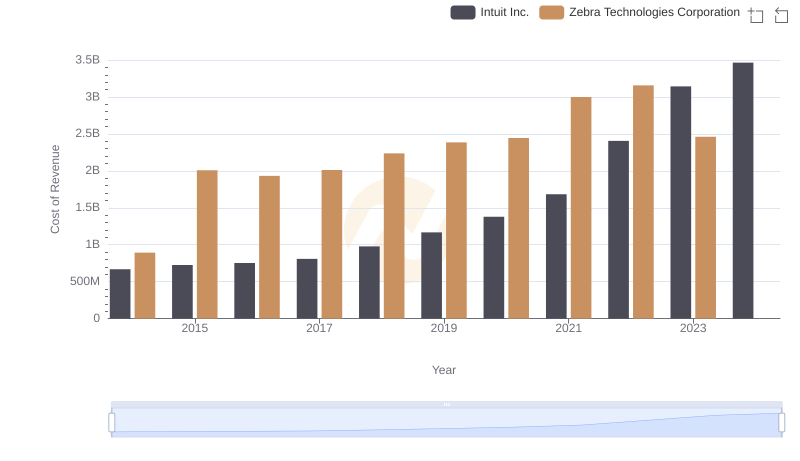
Cost of Revenue: Key Insights for Intuit Inc. and Zebra Technologies Corporation
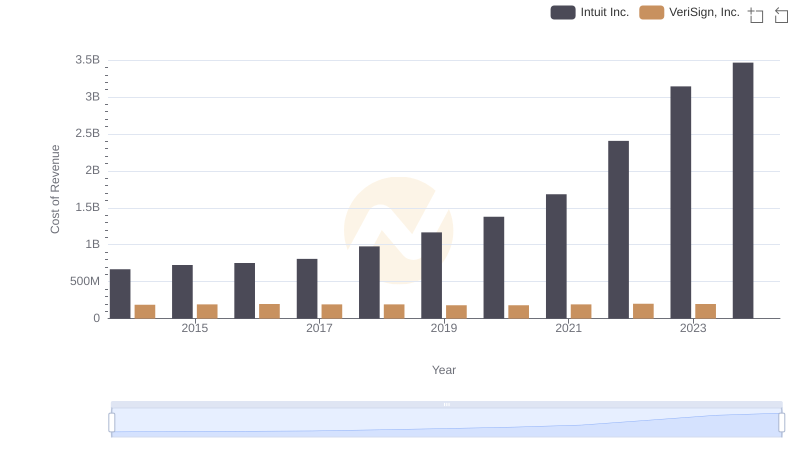
Comparing Cost of Revenue Efficiency: Intuit Inc. vs VeriSign, Inc.
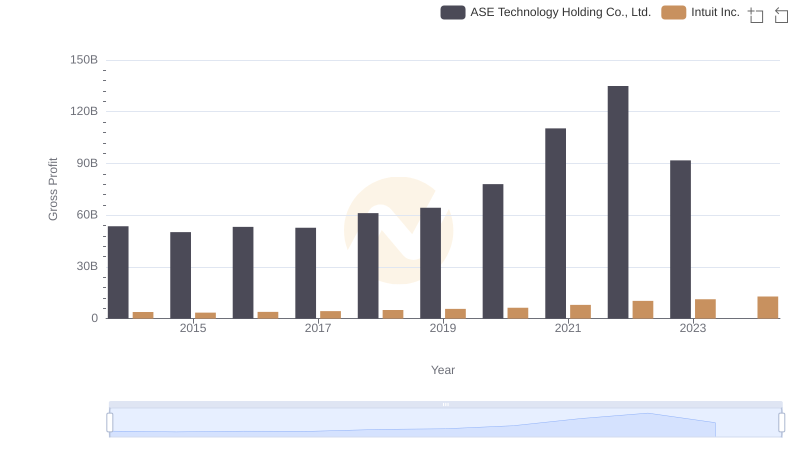
Intuit Inc. vs ASE Technology Holding Co., Ltd.: A Gross Profit Performance Breakdown
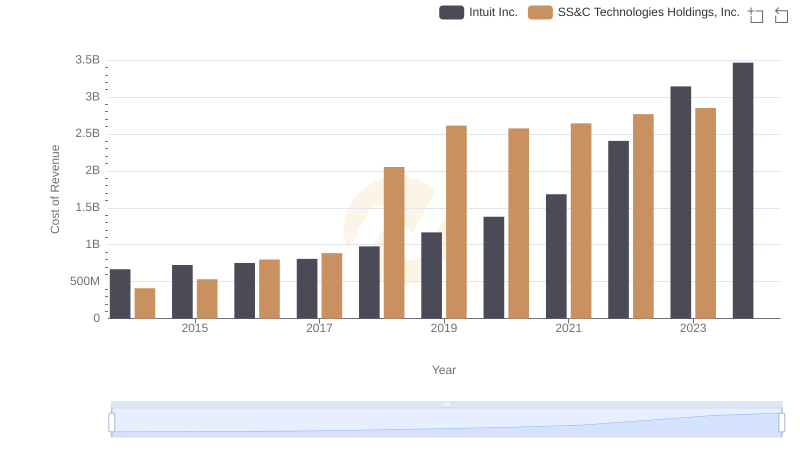
Cost of Revenue Trends: Intuit Inc. vs SS&C Technologies Holdings, Inc.
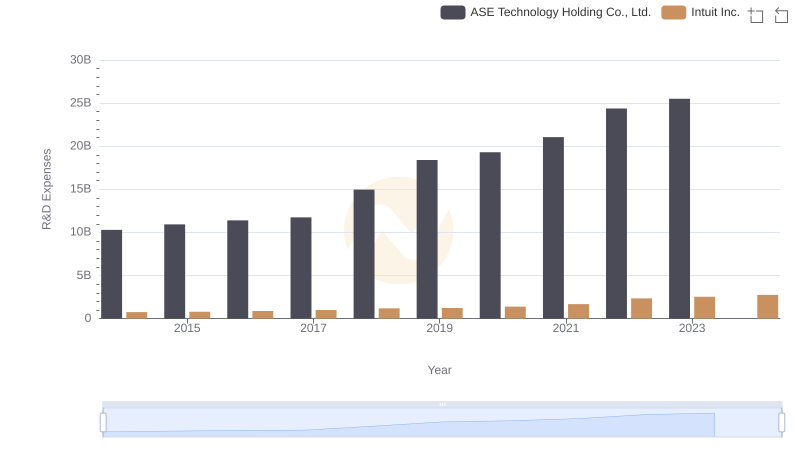
Intuit Inc. or ASE Technology Holding Co., Ltd.: Who Invests More in Innovation?
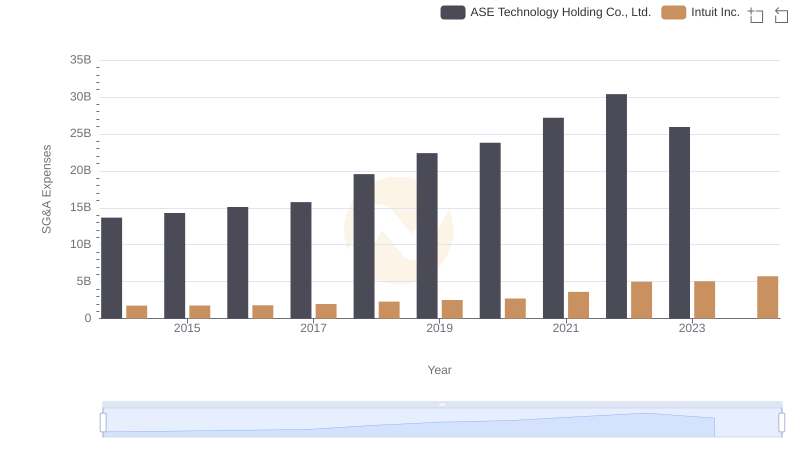
Cost Management Insights: SG&A Expenses for Intuit Inc. and ASE Technology Holding Co., Ltd.
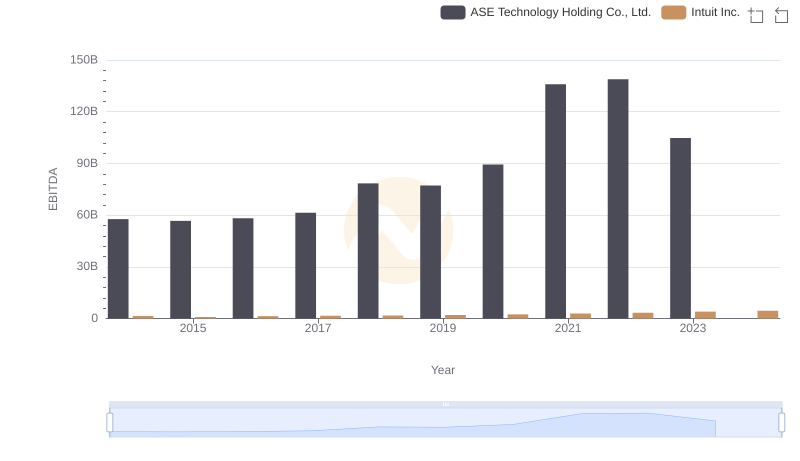
EBITDA Metrics Evaluated: Intuit Inc. vs ASE Technology Holding Co., Ltd.