| __timestamp | ASE Technology Holding Co., Ltd. | Intuit Inc. |
|---|---|---|
| Wednesday, January 1, 2014 | 256591000000 | 4506000000 |
| Thursday, January 1, 2015 | 283302000000 | 4192000000 |
| Friday, January 1, 2016 | 274884000000 | 4694000000 |
| Sunday, January 1, 2017 | 290441000000 | 5177000000 |
| Monday, January 1, 2018 | 371092000000 | 5964000000 |
| Tuesday, January 1, 2019 | 413182000000 | 6784000000 |
| Wednesday, January 1, 2020 | 476978000000 | 7679000000 |
| Friday, January 1, 2021 | 569997000000 | 9633000000 |
| Saturday, January 1, 2022 | 670873000000 | 12726000000 |
| Sunday, January 1, 2023 | 581914471000 | 14368000000 |
| Monday, January 1, 2024 | 595410063000 | 16285000000 |
Cracking the code
In the ever-evolving landscape of global business, the financial trajectories of Intuit Inc. and ASE Technology Holding Co., Ltd. offer a fascinating study in contrasts. Over the past decade, ASE Technology has consistently outpaced Intuit in terms of revenue, boasting figures that are nearly 50 times greater. However, Intuit's growth story is equally compelling, with its revenue nearly quadrupling from 2014 to 2023.
From 2014 to 2023, ASE Technology's revenue surged by approximately 127%, peaking in 2022. Meanwhile, Intuit's revenue grew by an impressive 218%, reflecting its strategic expansion and innovation in financial software solutions. Notably, 2023 saw Intuit's revenue reach new heights, while ASE Technology experienced a slight dip, highlighting the dynamic nature of the tech industry.
As we look to the future, these trends underscore the importance of adaptability and innovation in maintaining competitive advantage.
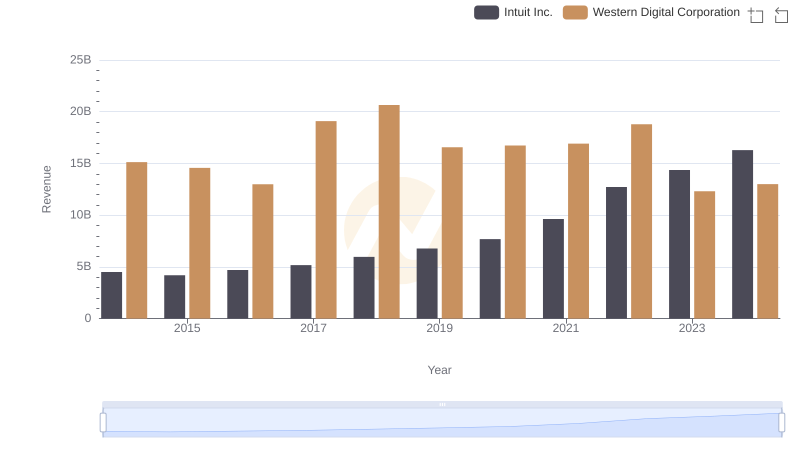
Intuit Inc. vs Western Digital Corporation: Annual Revenue Growth Compared
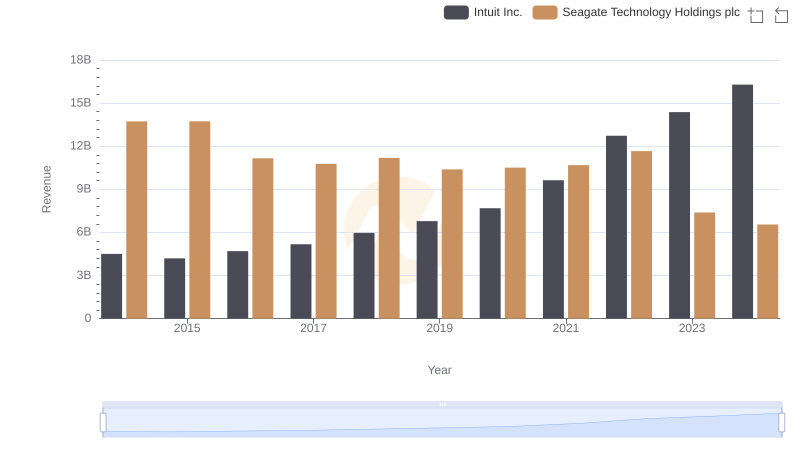
Revenue Showdown: Intuit Inc. vs Seagate Technology Holdings plc
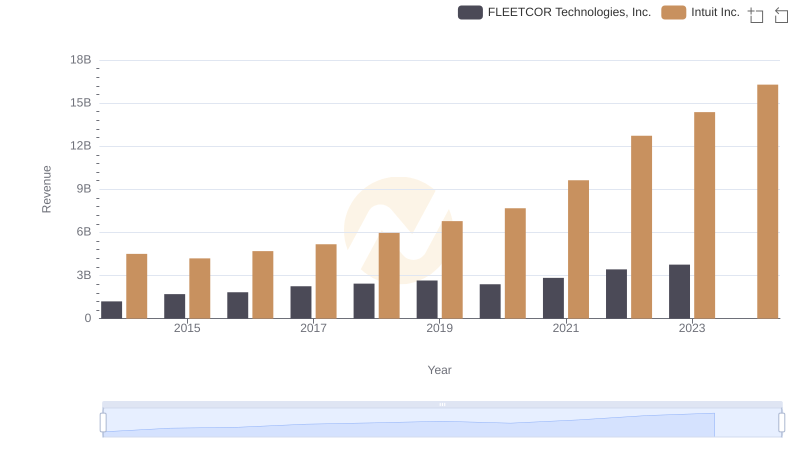
Revenue Showdown: Intuit Inc. vs FLEETCOR Technologies, Inc.
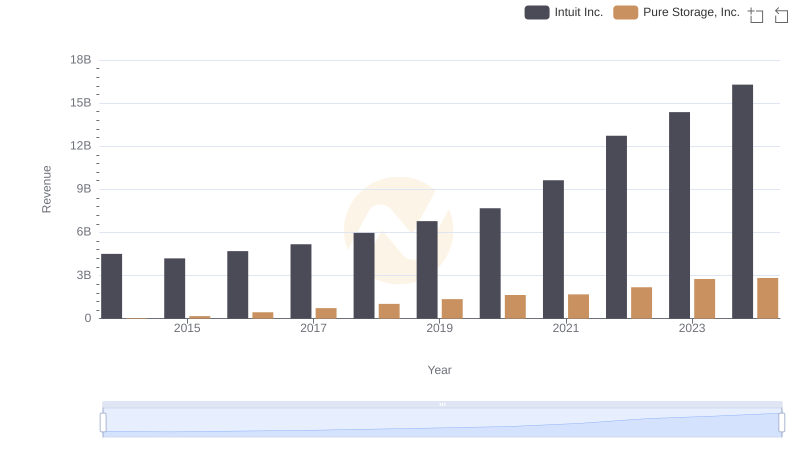
Intuit Inc. or Pure Storage, Inc.: Who Leads in Yearly Revenue?
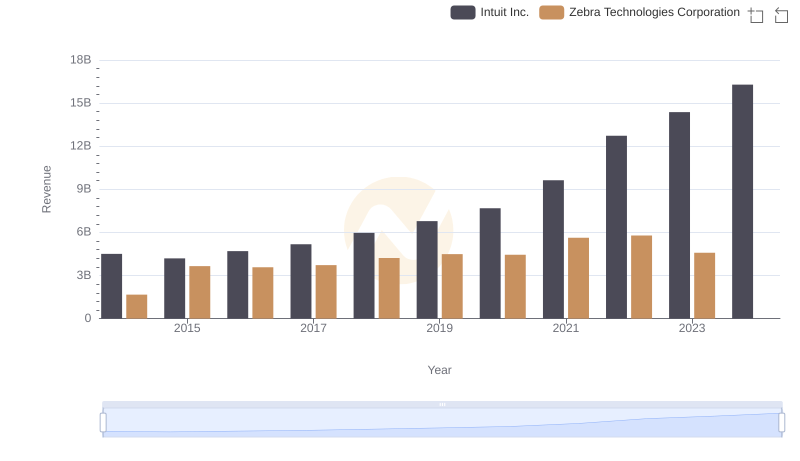
Intuit Inc. vs Zebra Technologies Corporation: Examining Key Revenue Metrics
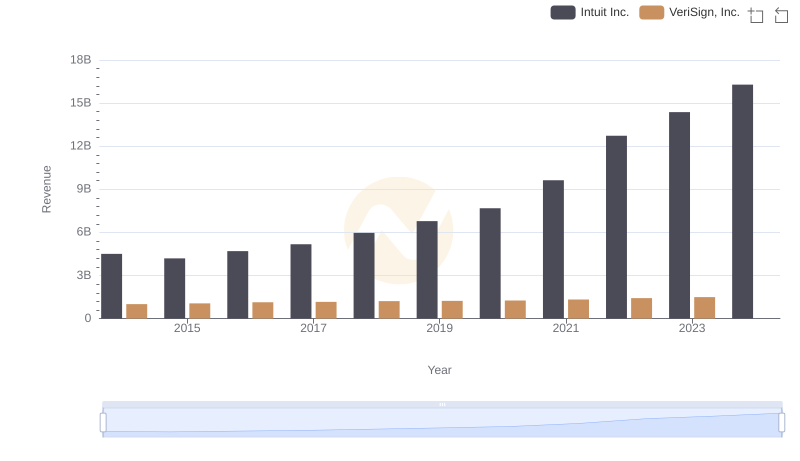
Who Generates More Revenue? Intuit Inc. or VeriSign, Inc.
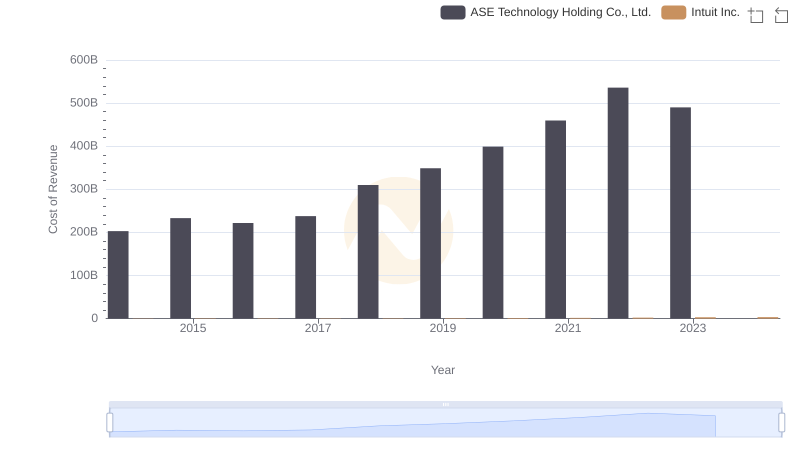
Cost of Revenue Comparison: Intuit Inc. vs ASE Technology Holding Co., Ltd.
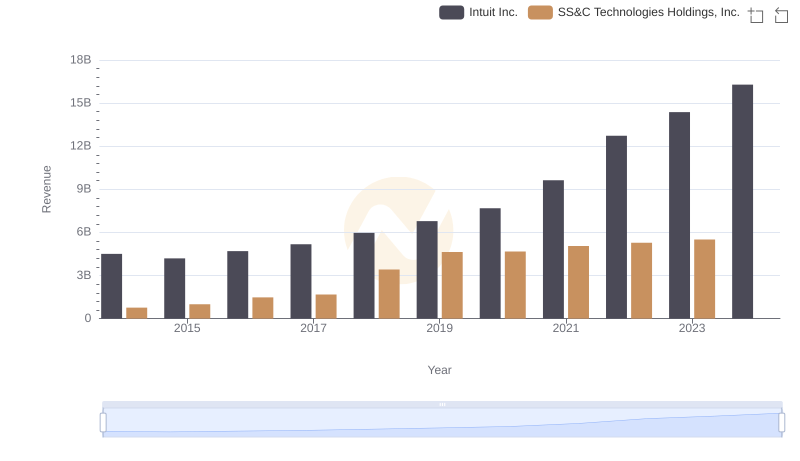
Comparing Revenue Performance: Intuit Inc. or SS&C Technologies Holdings, Inc.?
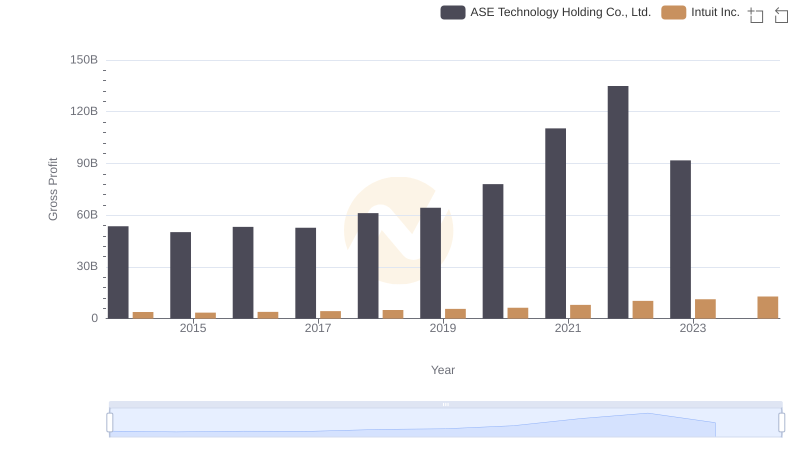
Intuit Inc. vs ASE Technology Holding Co., Ltd.: A Gross Profit Performance Breakdown
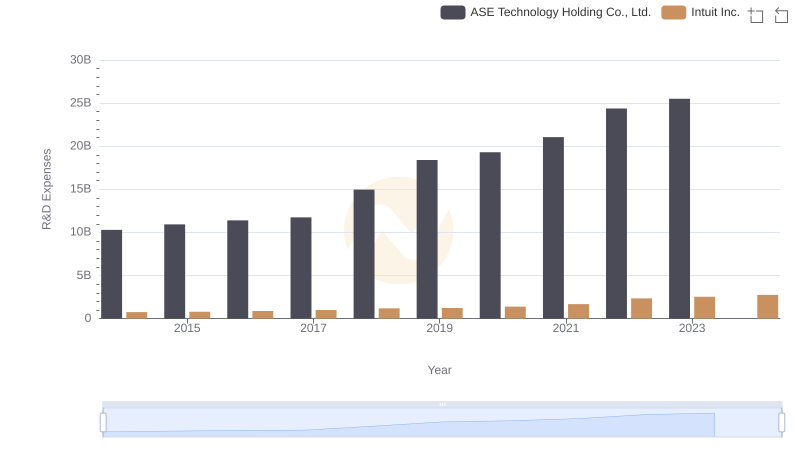
Intuit Inc. or ASE Technology Holding Co., Ltd.: Who Invests More in Innovation?
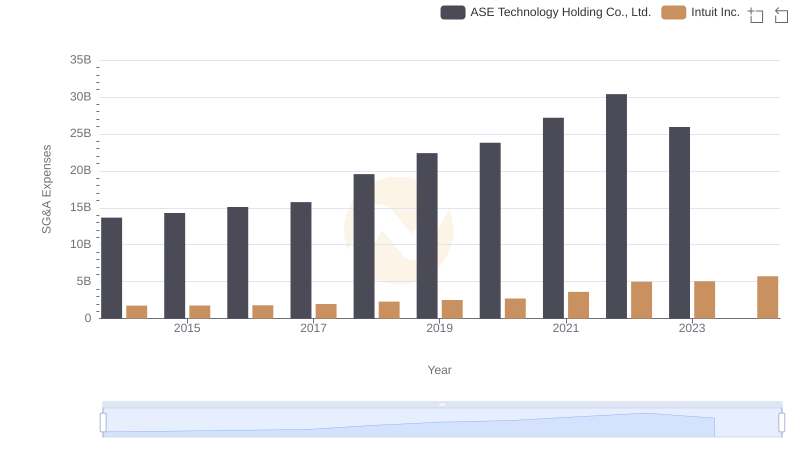
Cost Management Insights: SG&A Expenses for Intuit Inc. and ASE Technology Holding Co., Ltd.
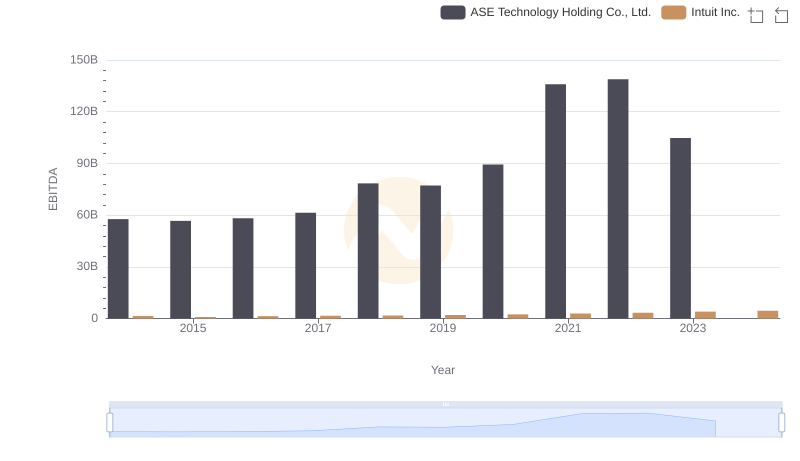
EBITDA Metrics Evaluated: Intuit Inc. vs ASE Technology Holding Co., Ltd.