| __timestamp | FLEETCOR Technologies, Inc. | Intuit Inc. |
|---|---|---|
| Wednesday, January 1, 2014 | 173337000 | 668000000 |
| Thursday, January 1, 2015 | 331073000 | 725000000 |
| Friday, January 1, 2016 | 355414000 | 752000000 |
| Sunday, January 1, 2017 | 429613000 | 809000000 |
| Monday, January 1, 2018 | 487695000 | 977000000 |
| Tuesday, January 1, 2019 | 530669000 | 1167000000 |
| Wednesday, January 1, 2020 | 596363000 | 1378000000 |
| Friday, January 1, 2021 | 559819000 | 1683000000 |
| Saturday, January 1, 2022 | 764707000 | 2406000000 |
| Sunday, January 1, 2023 | 1030138999 | 3143000000 |
| Monday, January 1, 2024 | 0 | 3465000000 |
Unlocking the unknown
In the ever-evolving landscape of financial technology, cost efficiency remains a pivotal factor for success. Over the past decade, Intuit Inc. and FLEETCOR Technologies, Inc. have demonstrated contrasting trajectories in managing their cost of revenue. From 2014 to 2023, Intuit Inc. has consistently outpaced FLEETCOR, with its cost of revenue growing from approximately 668 million to over 3.1 billion, marking a staggering 370% increase. Meanwhile, FLEETCOR's cost of revenue rose from 173 million to just over 1 billion, reflecting a 495% increase. Despite FLEETCOR's higher growth rate, Intuit's larger scale and consistent upward trend highlight its robust market position. Notably, 2024 data for FLEETCOR is missing, leaving room for speculation on its future performance. This comparison underscores the importance of strategic cost management in maintaining competitive advantage in the fintech sector.
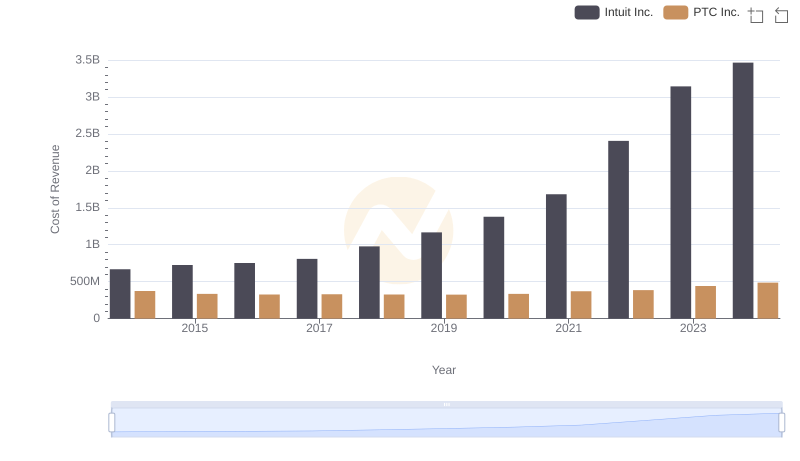
Cost of Revenue: Key Insights for Intuit Inc. and PTC Inc.
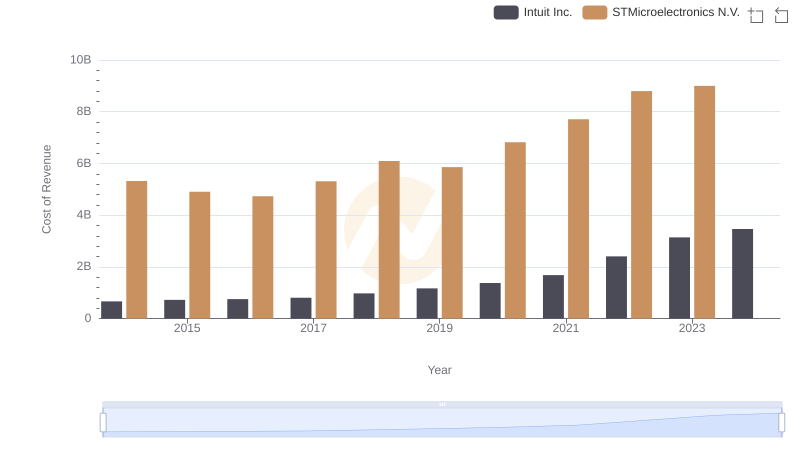
Cost Insights: Breaking Down Intuit Inc. and STMicroelectronics N.V.'s Expenses
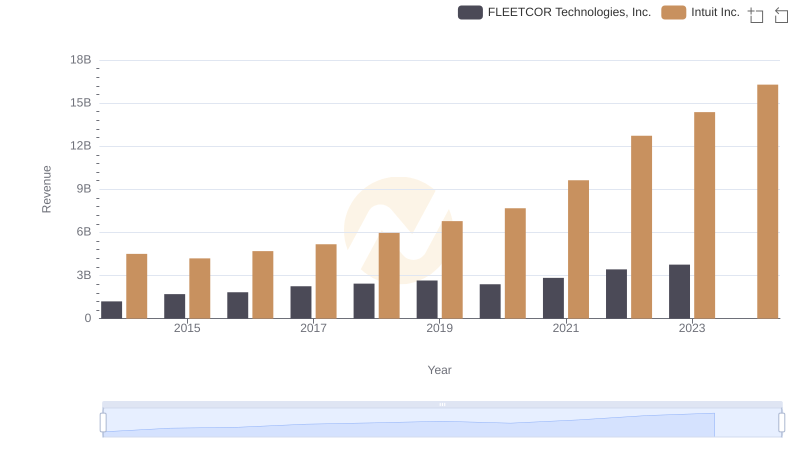
Revenue Showdown: Intuit Inc. vs FLEETCOR Technologies, Inc.
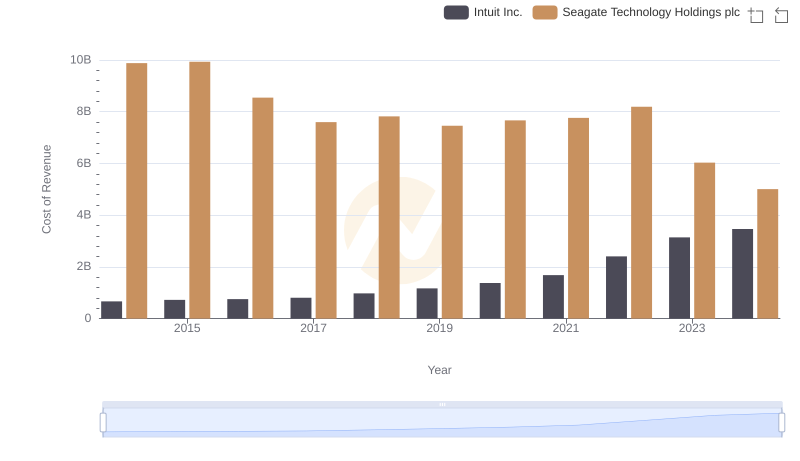
Cost Insights: Breaking Down Intuit Inc. and Seagate Technology Holdings plc's Expenses
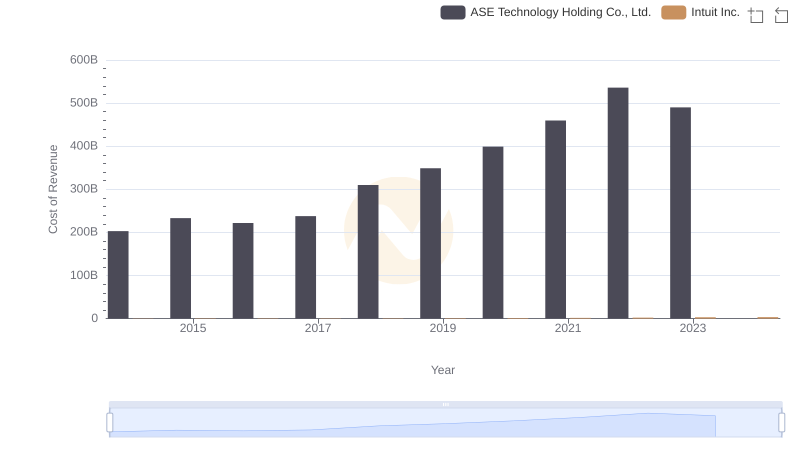
Cost of Revenue Comparison: Intuit Inc. vs ASE Technology Holding Co., Ltd.
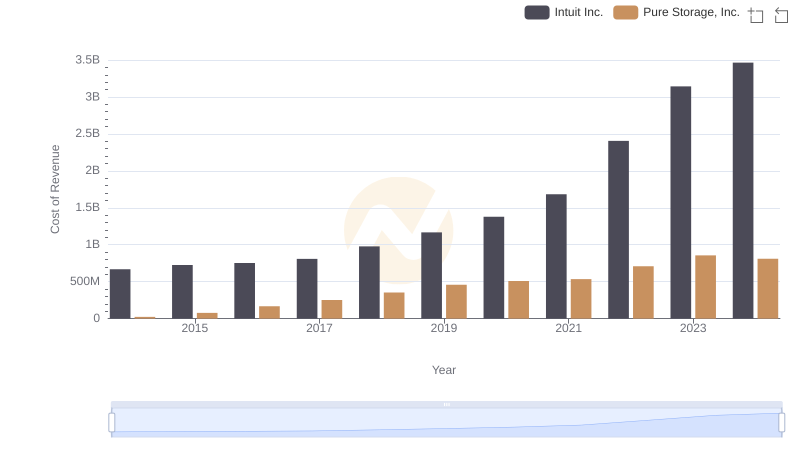
Analyzing Cost of Revenue: Intuit Inc. and Pure Storage, Inc.
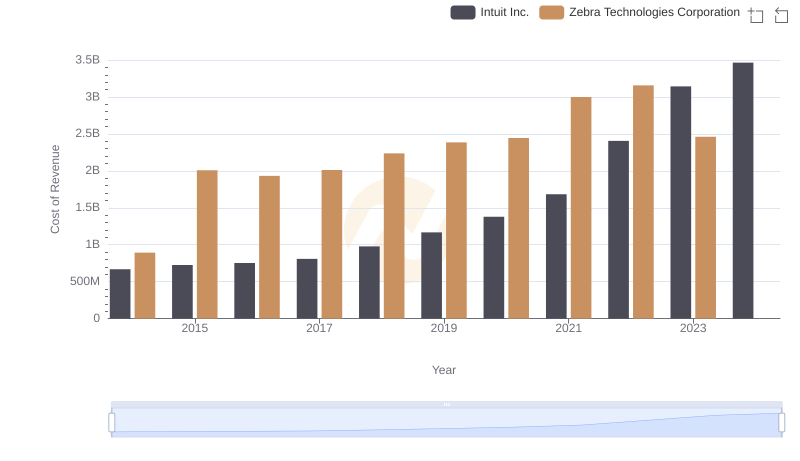
Cost of Revenue: Key Insights for Intuit Inc. and Zebra Technologies Corporation
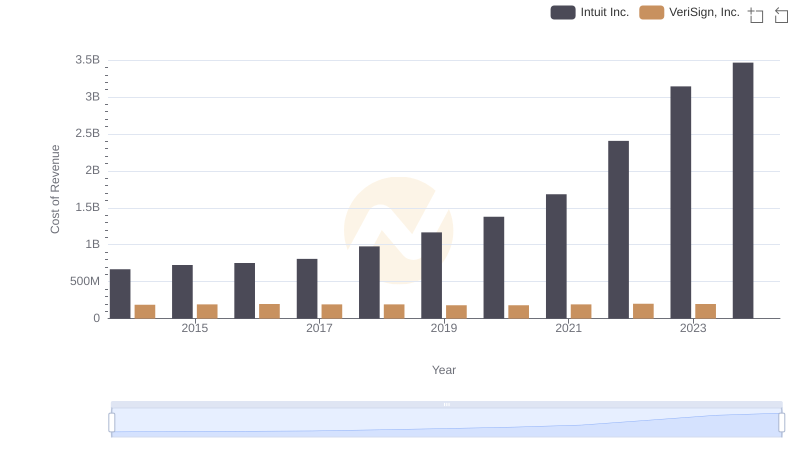
Comparing Cost of Revenue Efficiency: Intuit Inc. vs VeriSign, Inc.
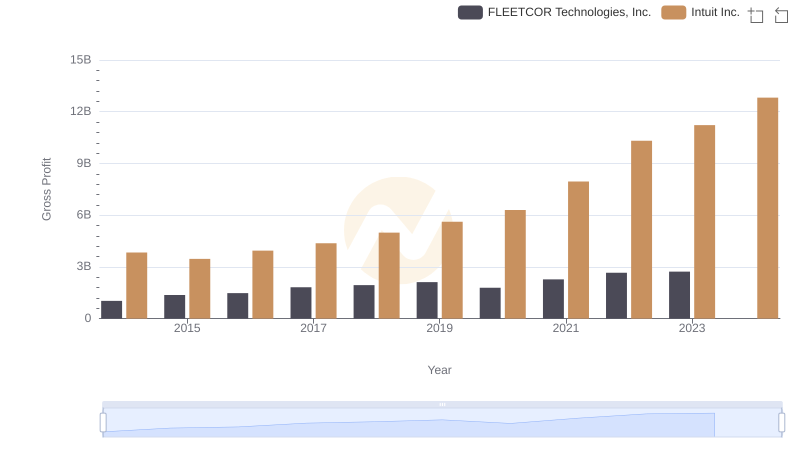
Gross Profit Trends Compared: Intuit Inc. vs FLEETCOR Technologies, Inc.
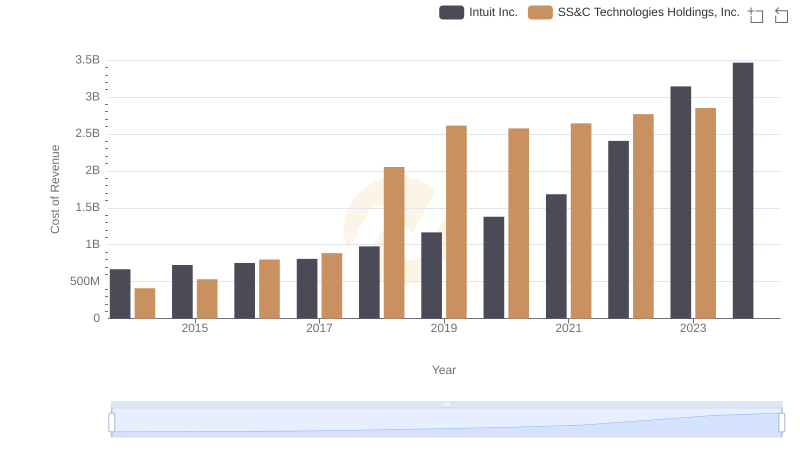
Cost of Revenue Trends: Intuit Inc. vs SS&C Technologies Holdings, Inc.
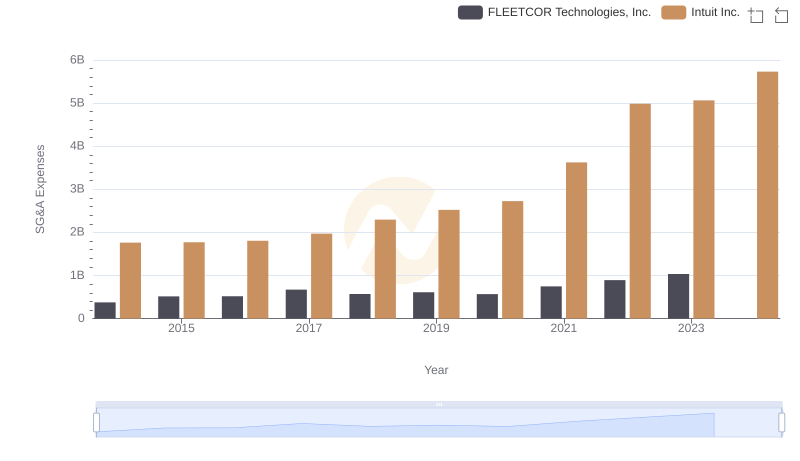
Comparing SG&A Expenses: Intuit Inc. vs FLEETCOR Technologies, Inc. Trends and Insights
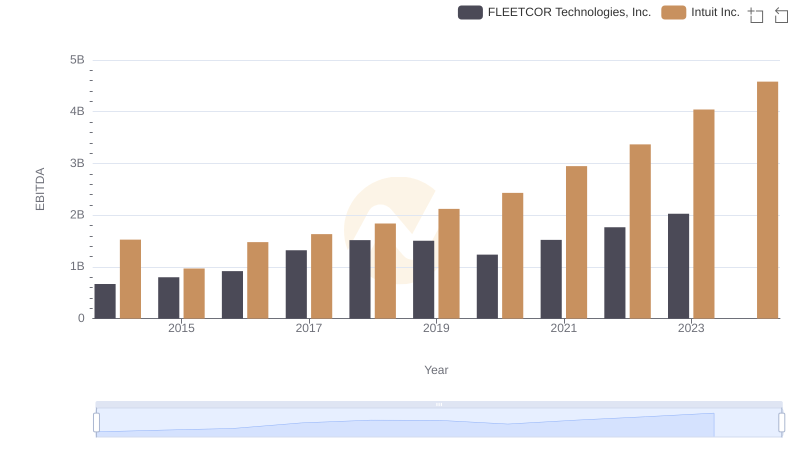
Professional EBITDA Benchmarking: Intuit Inc. vs FLEETCOR Technologies, Inc.