| __timestamp | Intuit Inc. | Pure Storage, Inc. |
|---|---|---|
| Wednesday, January 1, 2014 | 668000000 | 24129000 |
| Thursday, January 1, 2015 | 725000000 | 77552000 |
| Friday, January 1, 2016 | 752000000 | 167893000 |
| Sunday, January 1, 2017 | 809000000 | 252279000 |
| Monday, January 1, 2018 | 977000000 | 353781000 |
| Tuesday, January 1, 2019 | 1167000000 | 457528000 |
| Wednesday, January 1, 2020 | 1378000000 | 509886000 |
| Friday, January 1, 2021 | 1683000000 | 535255000 |
| Saturday, January 1, 2022 | 2406000000 | 708329000 |
| Sunday, January 1, 2023 | 3143000000 | 855788000 |
| Monday, January 1, 2024 | 3465000000 | 809430000 |
Unleashing the power of data
In the ever-evolving landscape of technology, understanding the cost dynamics of leading companies is crucial. From 2014 to 2024, Intuit Inc. and Pure Storage, Inc. have showcased distinct trajectories in their cost of revenue. Intuit Inc., a stalwart in financial software, has seen its cost of revenue surge by over 400%, reflecting its expansive growth and market penetration. In contrast, Pure Storage, Inc., a pioneer in data storage solutions, has experienced a more modest increase of approximately 320% during the same period. This divergence highlights Intuit's aggressive scaling strategies compared to Pure Storage's steady growth. Notably, by 2023, Intuit's cost of revenue was nearly four times that of Pure Storage, underscoring its dominant market position. As we look to 2024, these trends offer valuable insights into the strategic priorities and operational efficiencies of these tech giants.
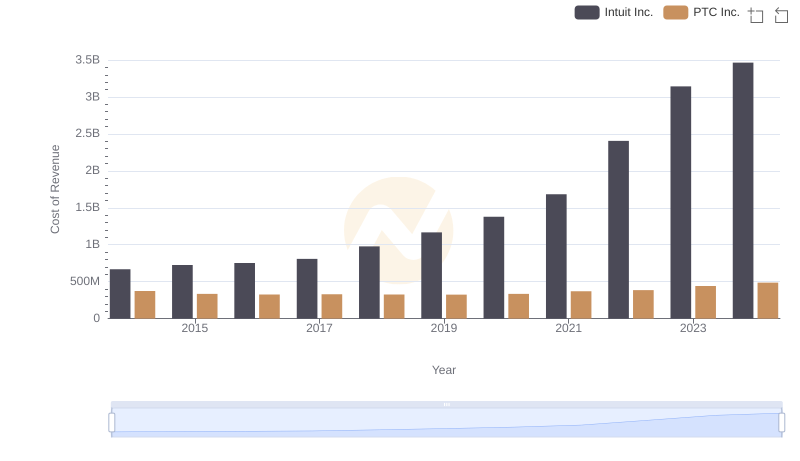
Cost of Revenue: Key Insights for Intuit Inc. and PTC Inc.
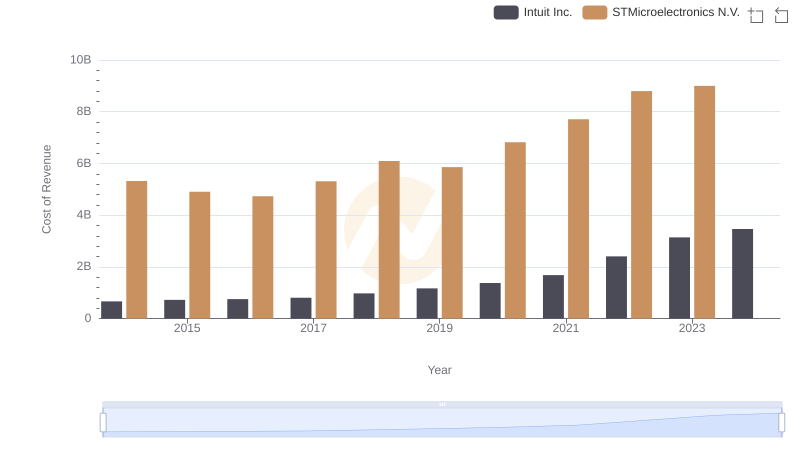
Cost Insights: Breaking Down Intuit Inc. and STMicroelectronics N.V.'s Expenses
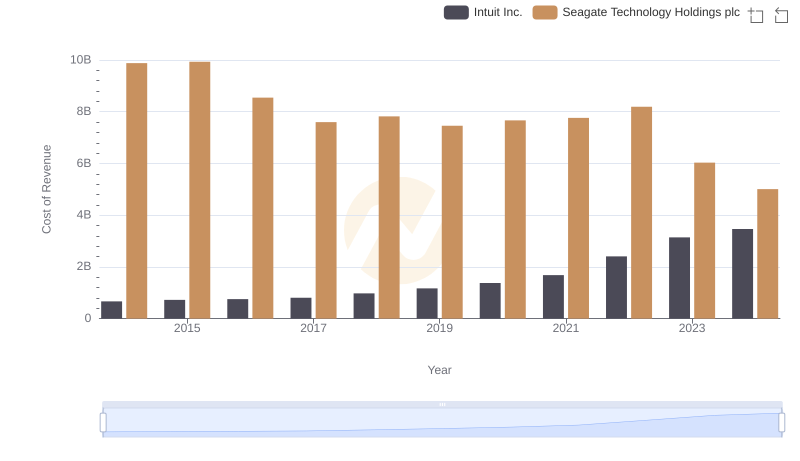
Cost Insights: Breaking Down Intuit Inc. and Seagate Technology Holdings plc's Expenses
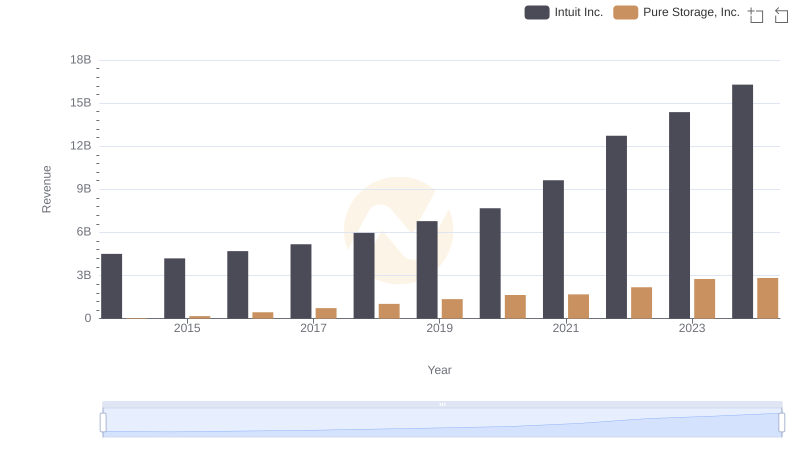
Intuit Inc. or Pure Storage, Inc.: Who Leads in Yearly Revenue?
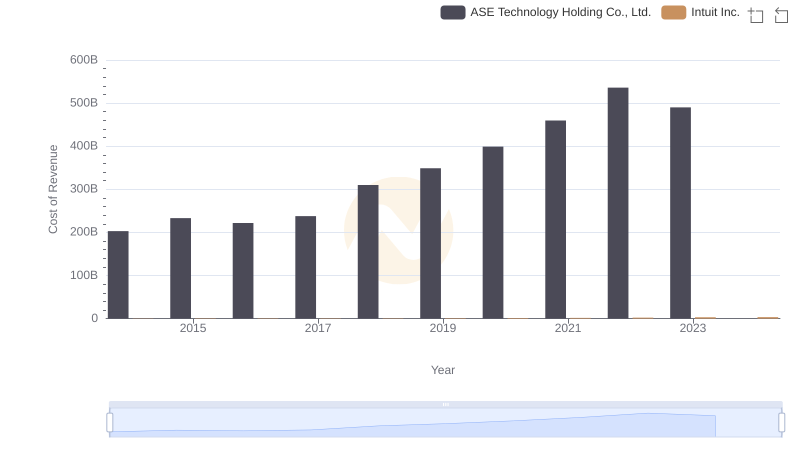
Cost of Revenue Comparison: Intuit Inc. vs ASE Technology Holding Co., Ltd.
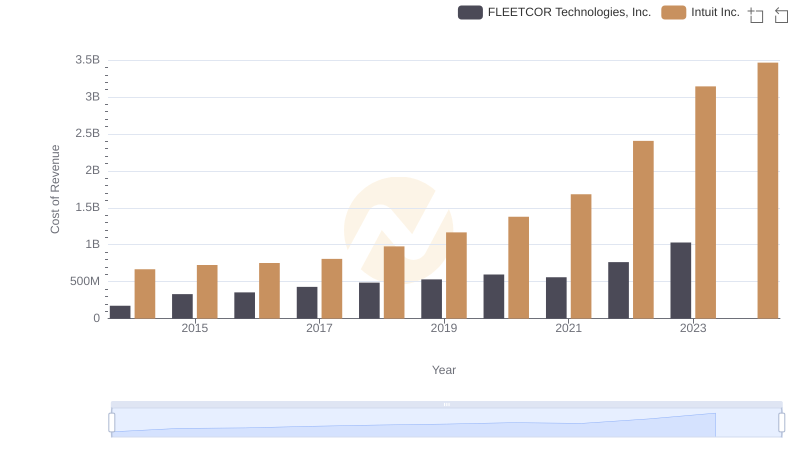
Comparing Cost of Revenue Efficiency: Intuit Inc. vs FLEETCOR Technologies, Inc.
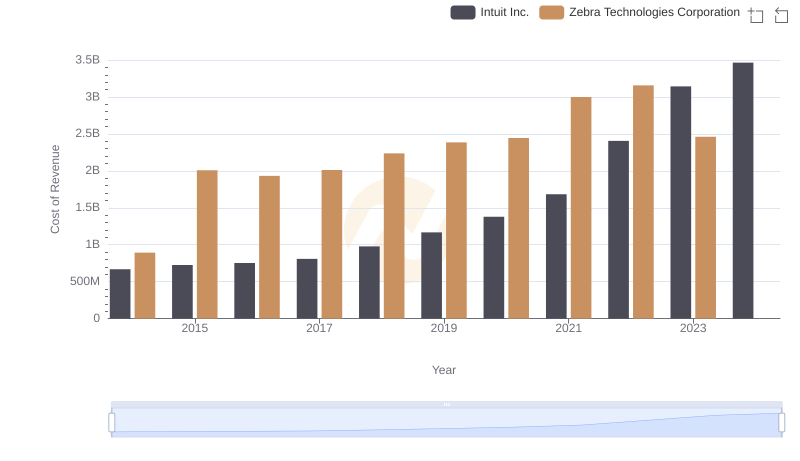
Cost of Revenue: Key Insights for Intuit Inc. and Zebra Technologies Corporation
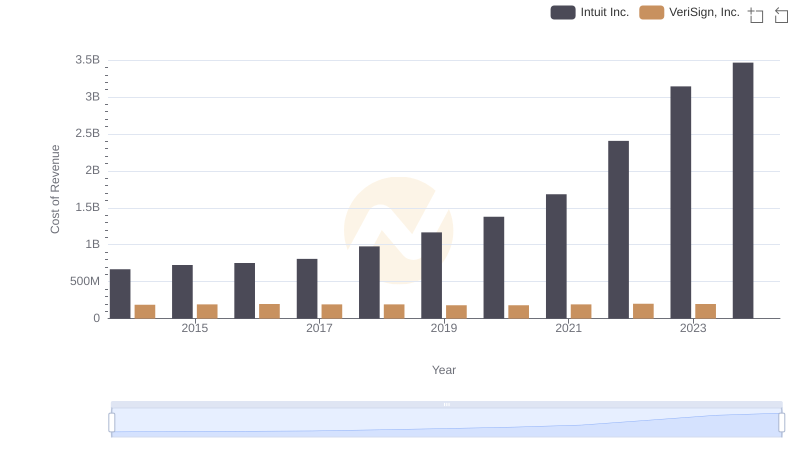
Comparing Cost of Revenue Efficiency: Intuit Inc. vs VeriSign, Inc.
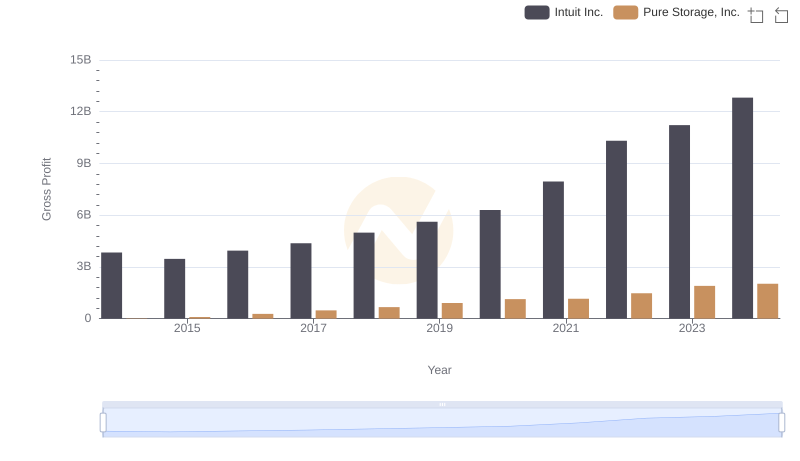
Intuit Inc. vs Pure Storage, Inc.: A Gross Profit Performance Breakdown
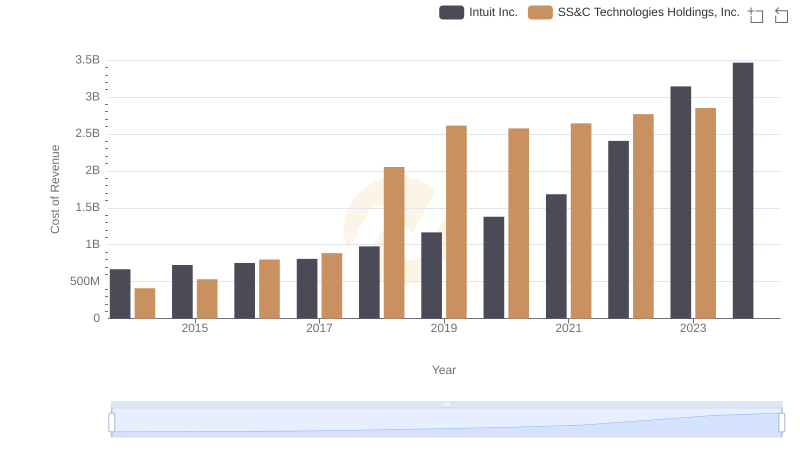
Cost of Revenue Trends: Intuit Inc. vs SS&C Technologies Holdings, Inc.
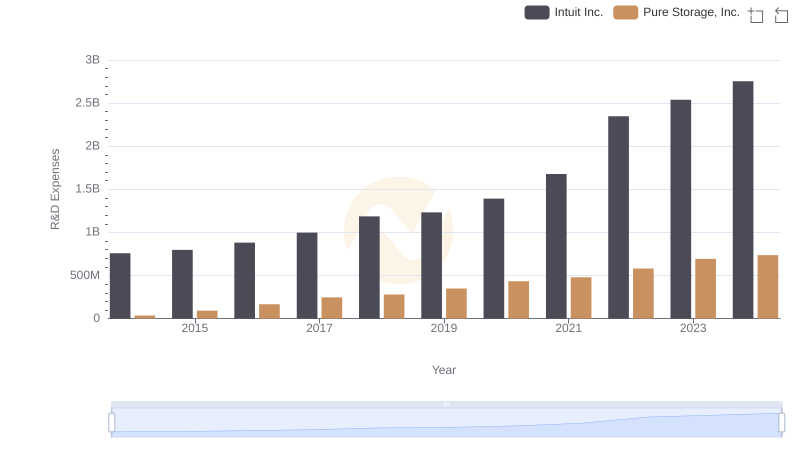
R&D Spending Showdown: Intuit Inc. vs Pure Storage, Inc.
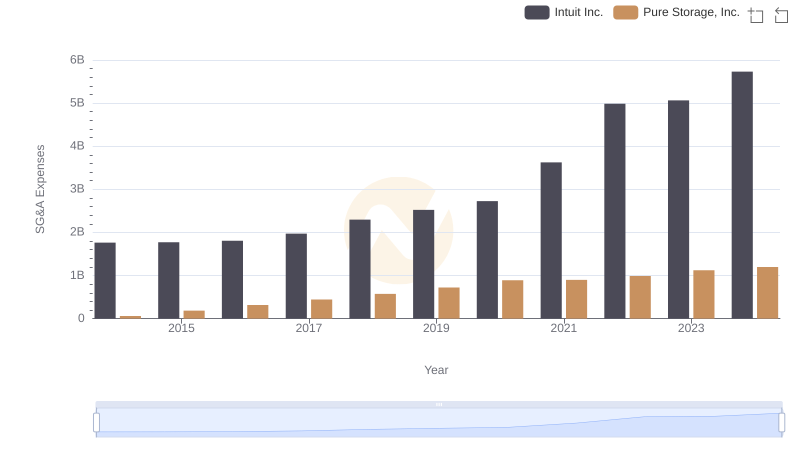
Comparing SG&A Expenses: Intuit Inc. vs Pure Storage, Inc. Trends and Insights