| __timestamp | Intuit Inc. | SS&C Technologies Holdings, Inc. |
|---|---|---|
| Wednesday, January 1, 2014 | 668000000 | 410731000 |
| Thursday, January 1, 2015 | 725000000 | 532350000 |
| Friday, January 1, 2016 | 752000000 | 800489000 |
| Sunday, January 1, 2017 | 809000000 | 886425000 |
| Monday, January 1, 2018 | 977000000 | 2051100000 |
| Tuesday, January 1, 2019 | 1167000000 | 2611700000 |
| Wednesday, January 1, 2020 | 1378000000 | 2574100000 |
| Friday, January 1, 2021 | 1683000000 | 2641700000 |
| Saturday, January 1, 2022 | 2406000000 | 2767700000 |
| Sunday, January 1, 2023 | 3143000000 | 2851000000 |
| Monday, January 1, 2024 | 3465000000 | 3018400000 |
Unlocking the unknown
In the ever-evolving landscape of financial technology, understanding cost dynamics is crucial. This analysis delves into the cost of revenue trends for Intuit Inc. and SS&C Technologies Holdings, Inc. from 2014 to 2023. Over this decade, Intuit Inc. has seen a remarkable increase in its cost of revenue, growing by over 400%, from approximately $668 million in 2014 to $3.1 billion in 2023. This surge reflects Intuit's aggressive expansion and investment in its product offerings.
Conversely, SS&C Technologies Holdings, Inc. experienced a more stable growth trajectory, with its cost of revenue increasing by nearly 600% from 2014 to 2022, peaking at $2.85 billion. However, data for 2024 is currently unavailable, leaving room for speculation on future trends. This comparison highlights the distinct financial strategies of these two industry giants, offering valuable insights for investors and analysts alike.
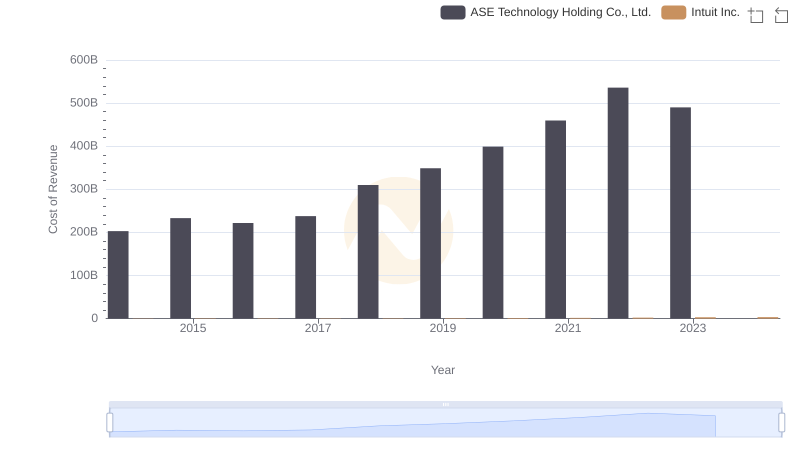
Cost of Revenue Comparison: Intuit Inc. vs ASE Technology Holding Co., Ltd.
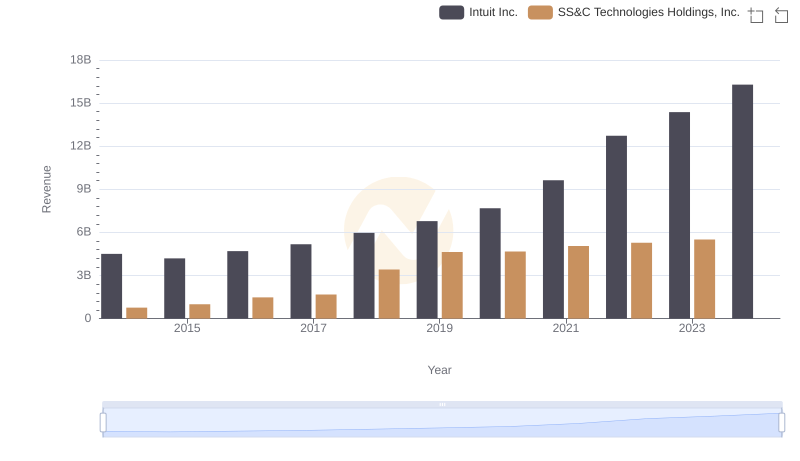
Comparing Revenue Performance: Intuit Inc. or SS&C Technologies Holdings, Inc.?
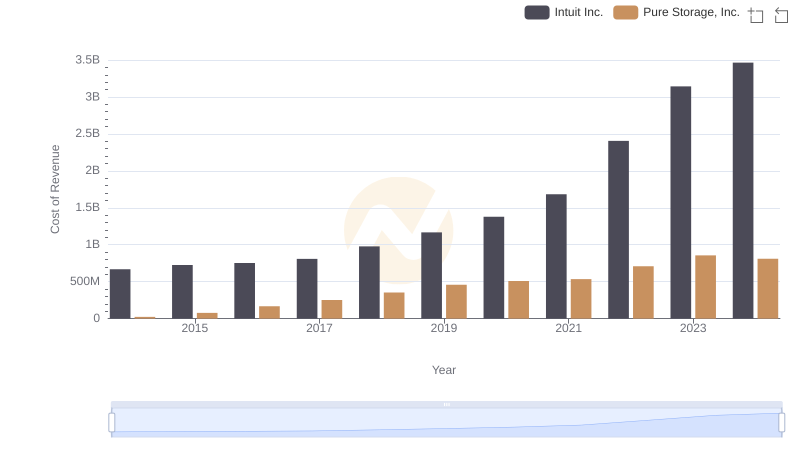
Analyzing Cost of Revenue: Intuit Inc. and Pure Storage, Inc.
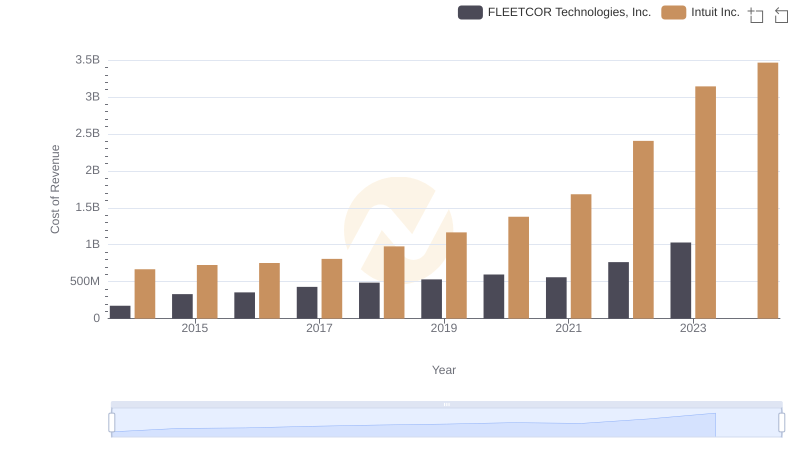
Comparing Cost of Revenue Efficiency: Intuit Inc. vs FLEETCOR Technologies, Inc.
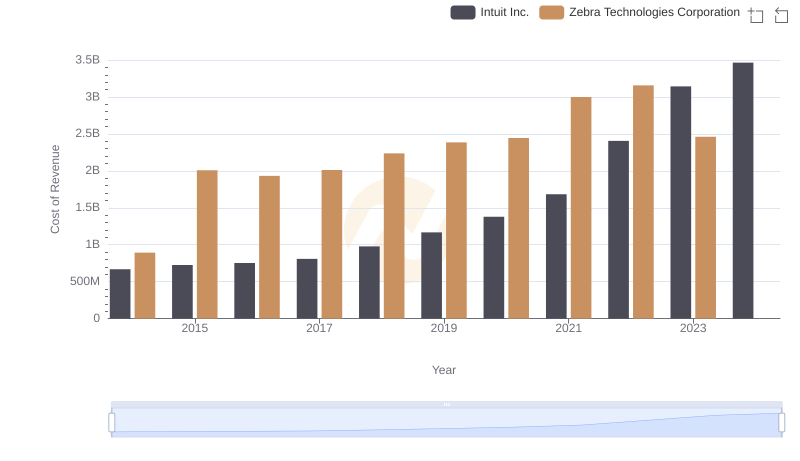
Cost of Revenue: Key Insights for Intuit Inc. and Zebra Technologies Corporation
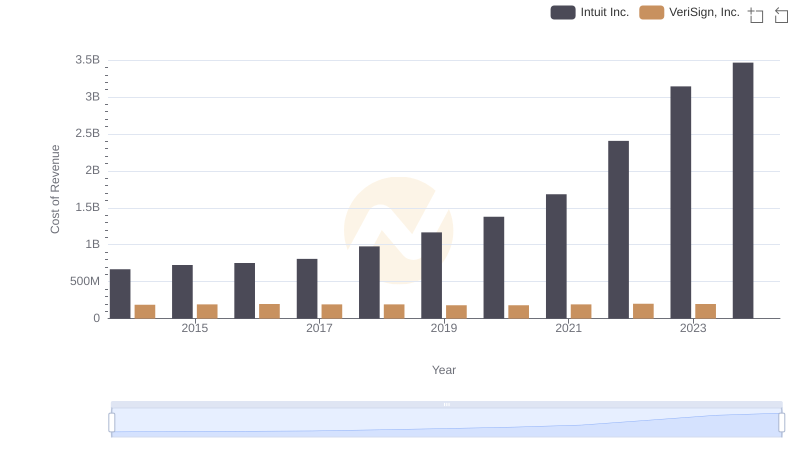
Comparing Cost of Revenue Efficiency: Intuit Inc. vs VeriSign, Inc.
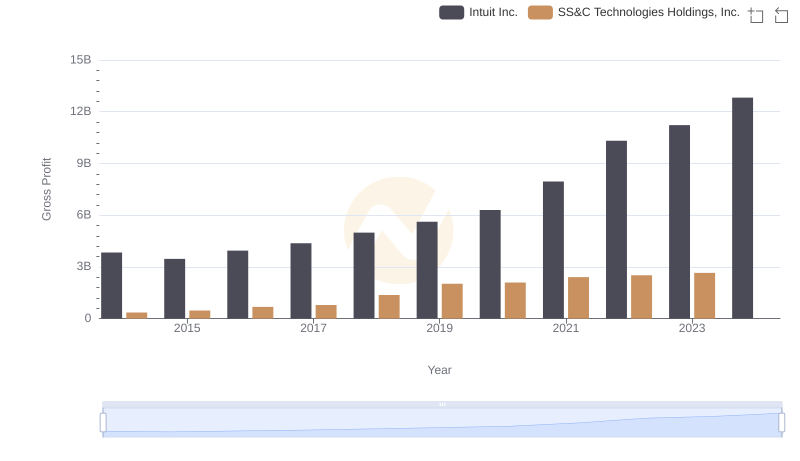
Gross Profit Comparison: Intuit Inc. and SS&C Technologies Holdings, Inc. Trends

Cost of Revenue Comparison: Intuit Inc. vs Teradyne, Inc.
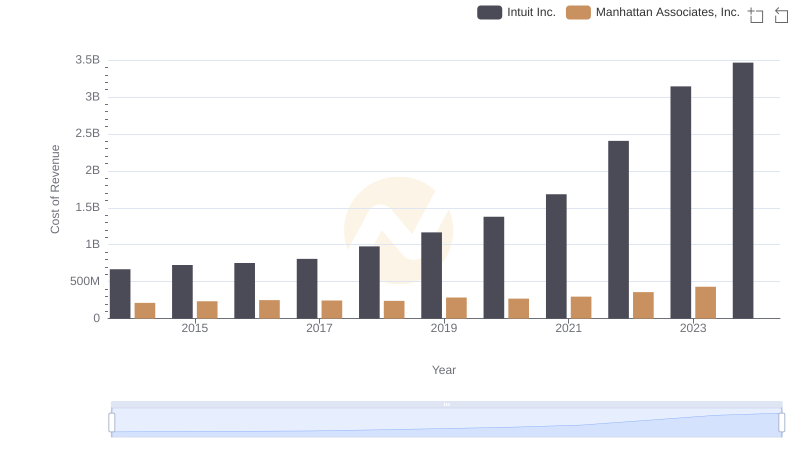
Analyzing Cost of Revenue: Intuit Inc. and Manhattan Associates, Inc.
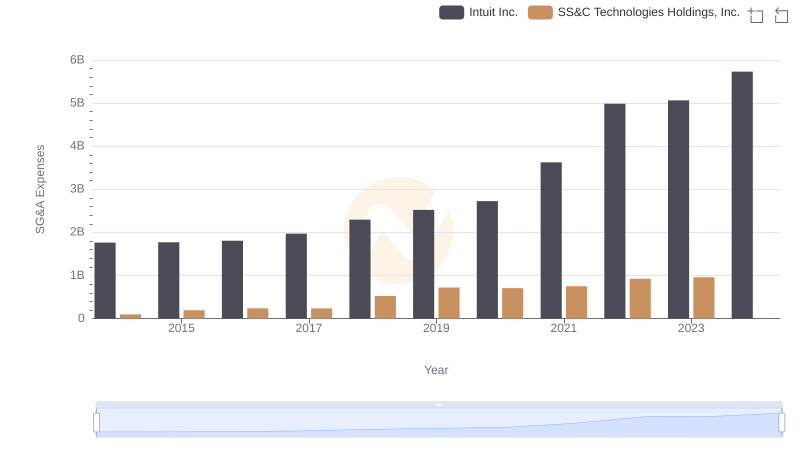
Cost Management Insights: SG&A Expenses for Intuit Inc. and SS&C Technologies Holdings, Inc.
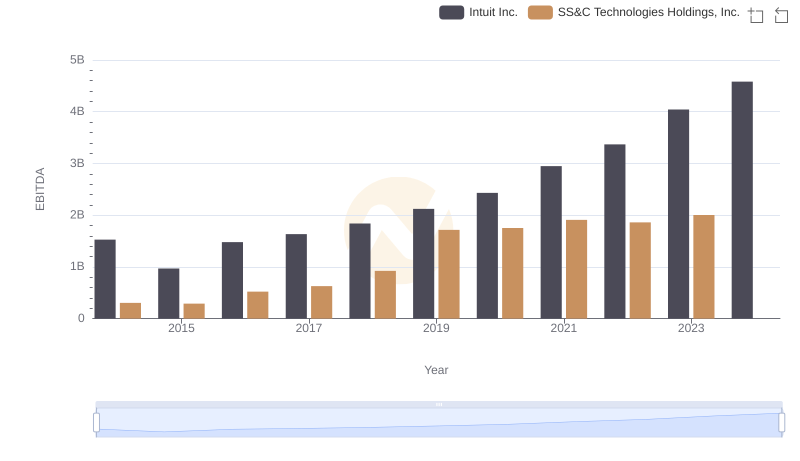
EBITDA Performance Review: Intuit Inc. vs SS&C Technologies Holdings, Inc.