| __timestamp | ASE Technology Holding Co., Ltd. | Intuit Inc. |
|---|---|---|
| Wednesday, January 1, 2014 | 13673000000 | 1762000000 |
| Thursday, January 1, 2015 | 14295000000 | 1771000000 |
| Friday, January 1, 2016 | 15099000000 | 1807000000 |
| Sunday, January 1, 2017 | 15767000000 | 1973000000 |
| Monday, January 1, 2018 | 19552000000 | 2298000000 |
| Tuesday, January 1, 2019 | 22389000000 | 2524000000 |
| Wednesday, January 1, 2020 | 23806000000 | 2727000000 |
| Friday, January 1, 2021 | 27191000000 | 3626000000 |
| Saturday, January 1, 2022 | 30384000000 | 4986000000 |
| Sunday, January 1, 2023 | 25930017000 | 5062000000 |
| Monday, January 1, 2024 | 27353513000 | 5730000000 |
Unleashing the power of data
In the ever-evolving landscape of corporate finance, understanding Selling, General, and Administrative (SG&A) expenses is crucial for effective cost management. This analysis delves into the SG&A trends of Intuit Inc. and ASE Technology Holding Co., Ltd. over the past decade. From 2014 to 2023, ASE Technology's SG&A expenses surged by approximately 90%, peaking in 2022. Meanwhile, Intuit Inc. experienced a steady increase, with expenses growing by over 200% during the same period, reflecting its strategic investments in growth and innovation.
Interestingly, 2023 marked a slight decline for ASE Technology, hinting at potential cost optimization strategies. In contrast, Intuit's expenses continued to rise, reaching new heights in 2024. This divergence underscores the distinct financial strategies of these industry giants. As businesses navigate the complexities of the modern economy, these insights offer valuable lessons in balancing growth with fiscal responsibility.
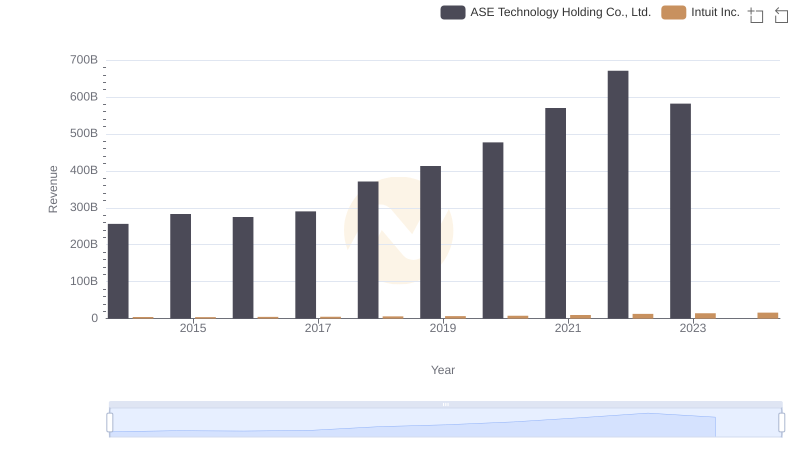
Annual Revenue Comparison: Intuit Inc. vs ASE Technology Holding Co., Ltd.
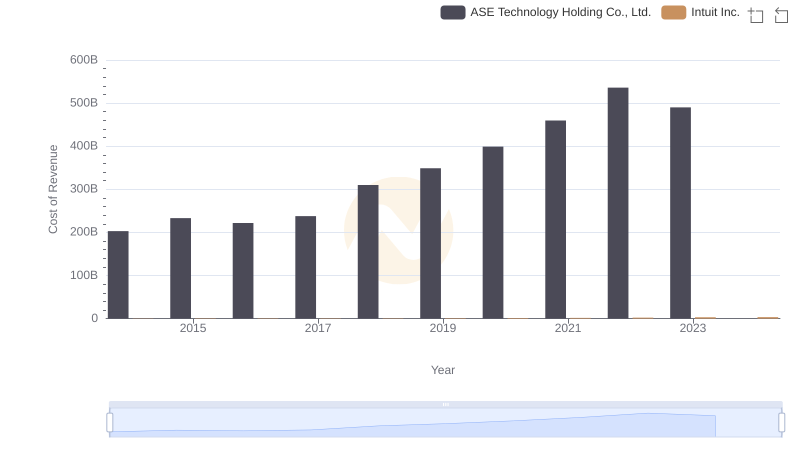
Cost of Revenue Comparison: Intuit Inc. vs ASE Technology Holding Co., Ltd.
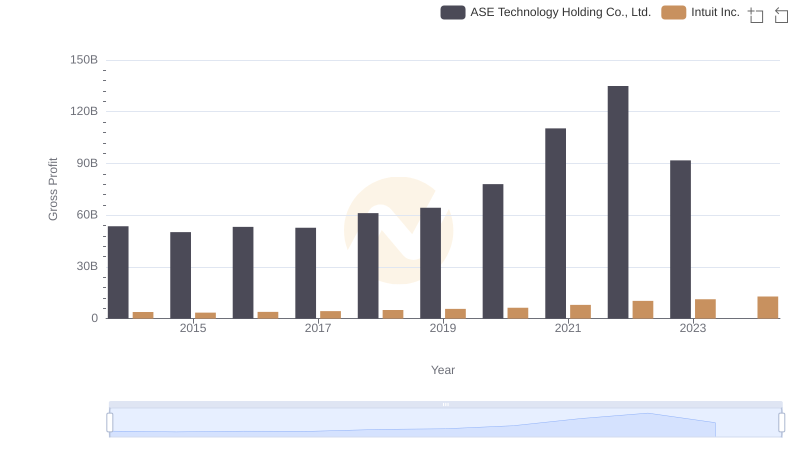
Intuit Inc. vs ASE Technology Holding Co., Ltd.: A Gross Profit Performance Breakdown
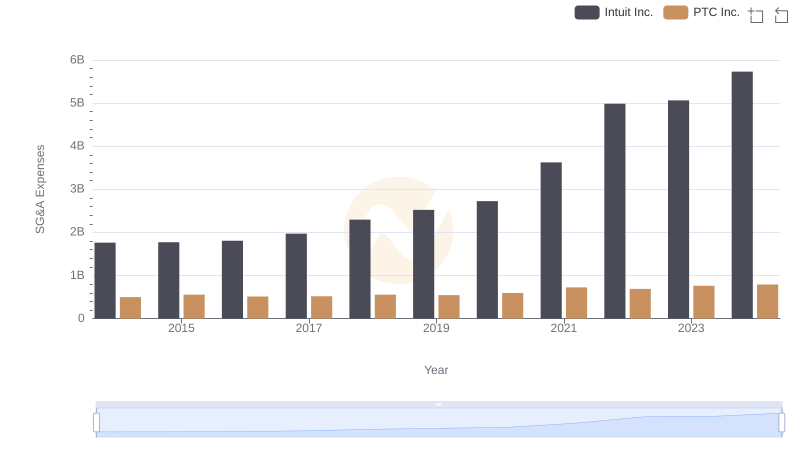
Selling, General, and Administrative Costs: Intuit Inc. vs PTC Inc.
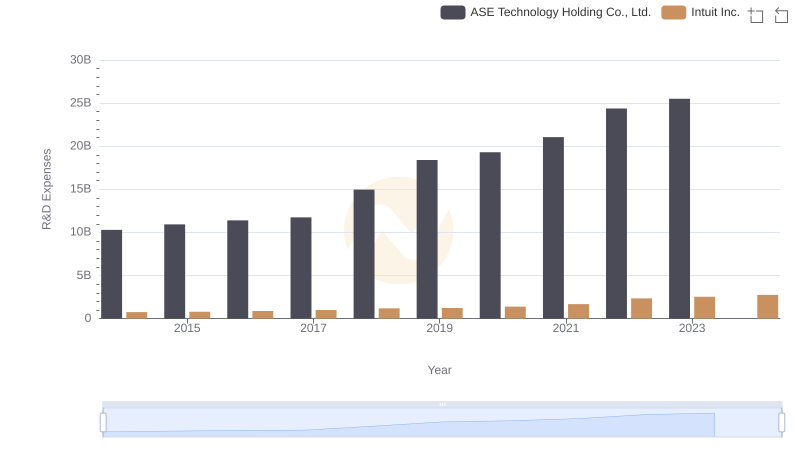
Intuit Inc. or ASE Technology Holding Co., Ltd.: Who Invests More in Innovation?
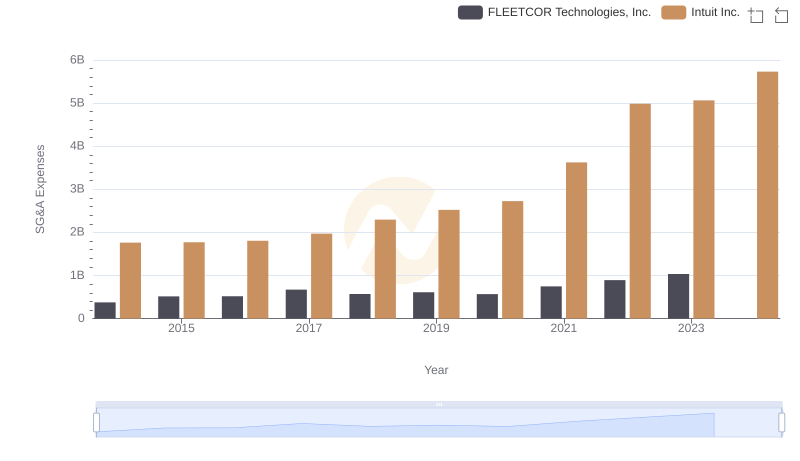
Comparing SG&A Expenses: Intuit Inc. vs FLEETCOR Technologies, Inc. Trends and Insights

Operational Costs Compared: SG&A Analysis of Intuit Inc. and Zebra Technologies Corporation
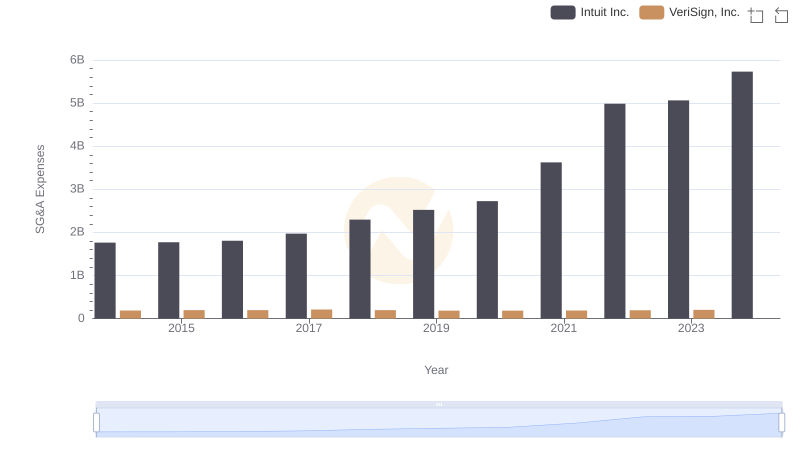
Intuit Inc. vs VeriSign, Inc.: SG&A Expense Trends
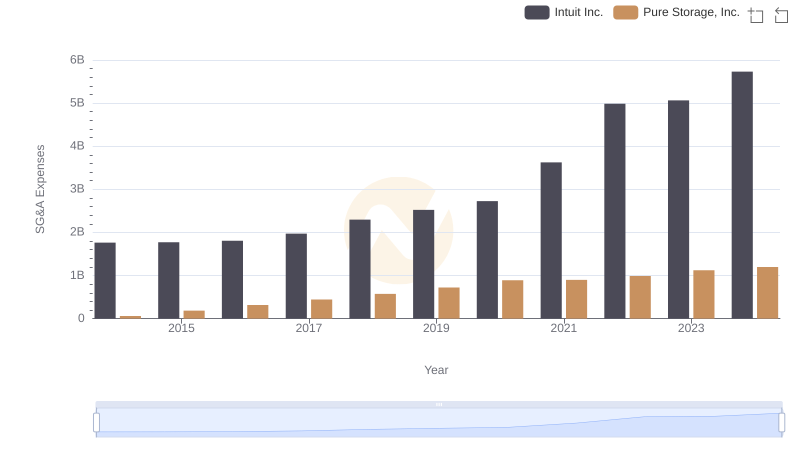
Comparing SG&A Expenses: Intuit Inc. vs Pure Storage, Inc. Trends and Insights
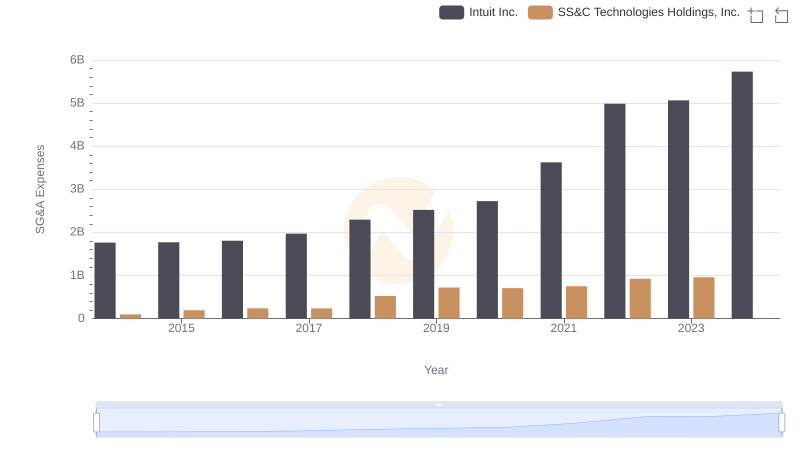
Cost Management Insights: SG&A Expenses for Intuit Inc. and SS&C Technologies Holdings, Inc.
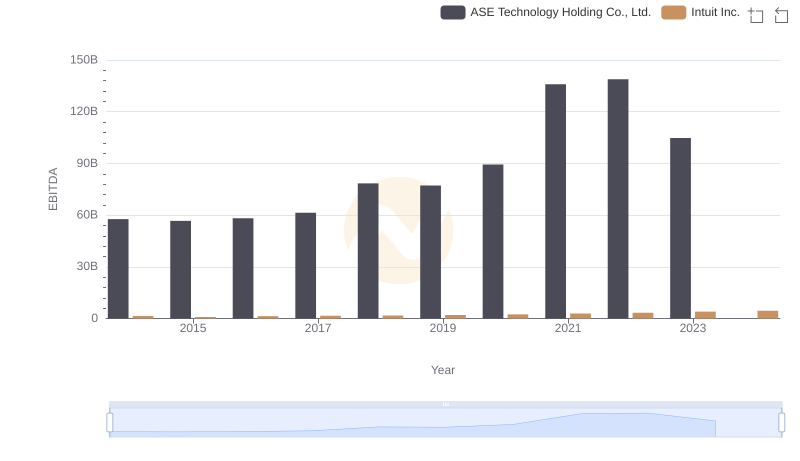
EBITDA Metrics Evaluated: Intuit Inc. vs ASE Technology Holding Co., Ltd.

Intuit Inc. and Teradyne, Inc.: SG&A Spending Patterns Compared