| __timestamp | Intuit Inc. | STMicroelectronics N.V. |
|---|---|---|
| Wednesday, January 1, 2014 | 668000000 | 5321000000 |
| Thursday, January 1, 2015 | 725000000 | 4907000000 |
| Friday, January 1, 2016 | 752000000 | 4731000000 |
| Sunday, January 1, 2017 | 809000000 | 5313000000 |
| Monday, January 1, 2018 | 977000000 | 6096000000 |
| Tuesday, January 1, 2019 | 1167000000 | 5860000000 |
| Wednesday, January 1, 2020 | 1378000000 | 6819000000 |
| Friday, January 1, 2021 | 1683000000 | 7708000000 |
| Saturday, January 1, 2022 | 2406000000 | 8797000000 |
| Sunday, January 1, 2023 | 3143000000 | 8999000000 |
| Monday, January 1, 2024 | 3465000000 |
Unleashing insights
In the ever-evolving landscape of global business, understanding cost structures is pivotal. This analysis delves into the cost of revenue trends for two industry giants: Intuit Inc., a leader in financial software, and STMicroelectronics N.V., a powerhouse in semiconductor manufacturing. From 2014 to 2023, Intuit's cost of revenue surged by over 400%, reflecting its aggressive growth strategy and expanding product offerings. In contrast, STMicroelectronics exhibited a steady increase of approximately 70% over the same period, underscoring its robust operational efficiency and market demand.
Notably, 2023 marked a peak for both companies, with Intuit reaching a cost of revenue of $3.1 billion, while STMicroelectronics hit $9 billion. However, data for 2024 is incomplete for STMicroelectronics, indicating potential shifts in their financial strategies. This comparative insight not only highlights the dynamic nature of these industries but also offers a glimpse into their future trajectories.
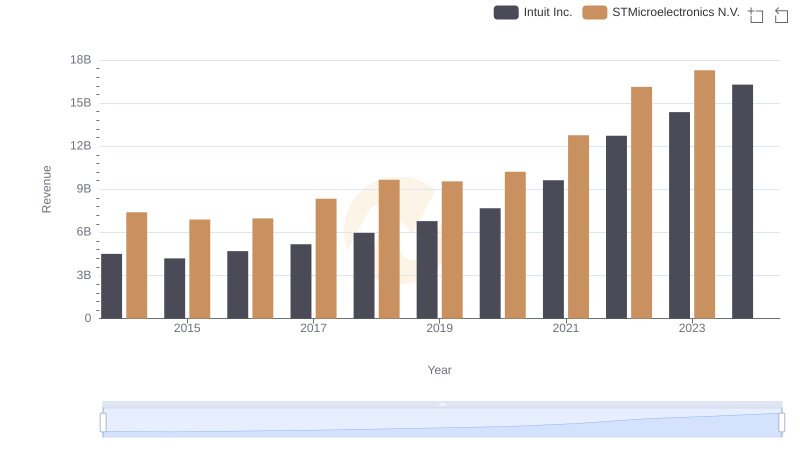
Breaking Down Revenue Trends: Intuit Inc. vs STMicroelectronics N.V.
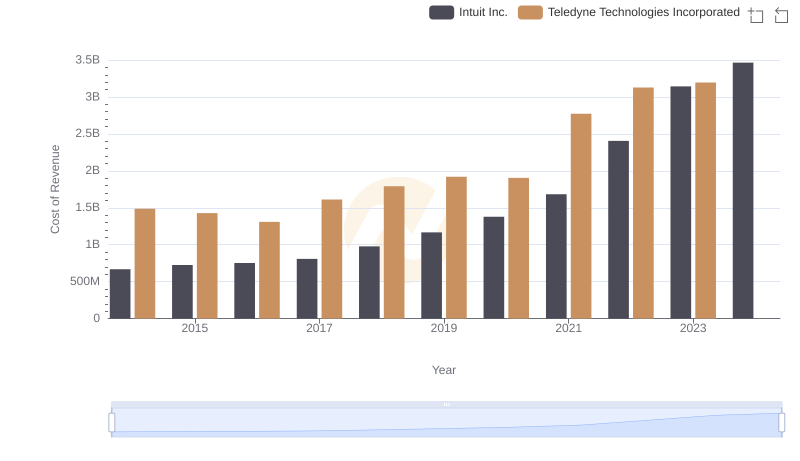
Intuit Inc. vs Teledyne Technologies Incorporated: Efficiency in Cost of Revenue Explored
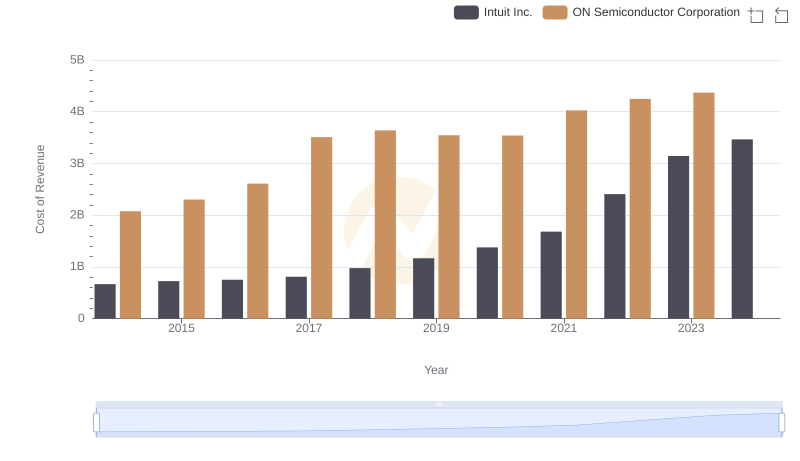
Comparing Cost of Revenue Efficiency: Intuit Inc. vs ON Semiconductor Corporation
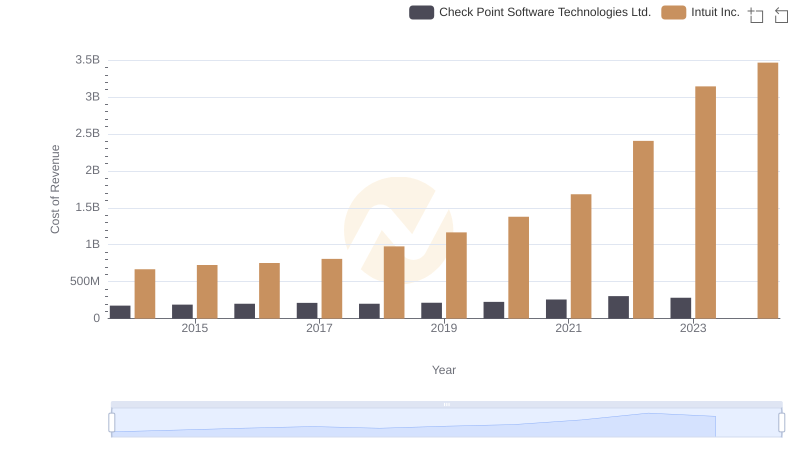
Comparing Cost of Revenue Efficiency: Intuit Inc. vs Check Point Software Technologies Ltd.
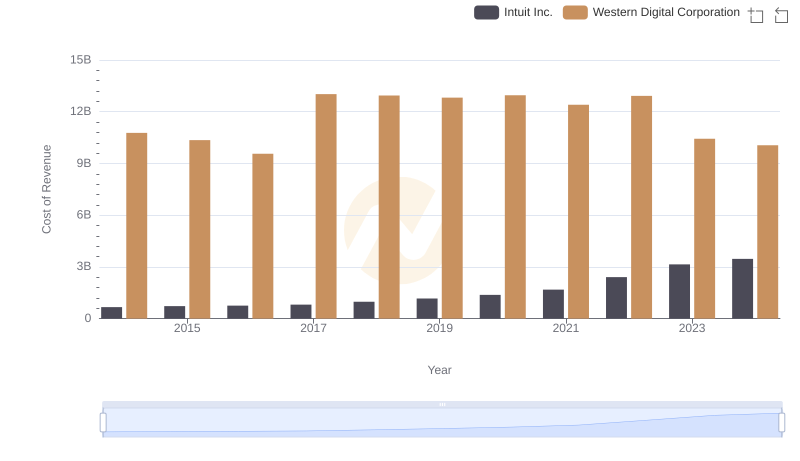
Cost of Revenue Trends: Intuit Inc. vs Western Digital Corporation
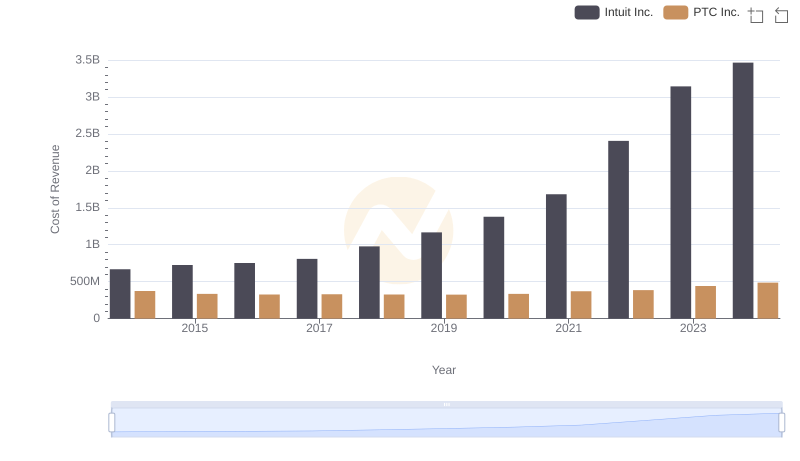
Cost of Revenue: Key Insights for Intuit Inc. and PTC Inc.
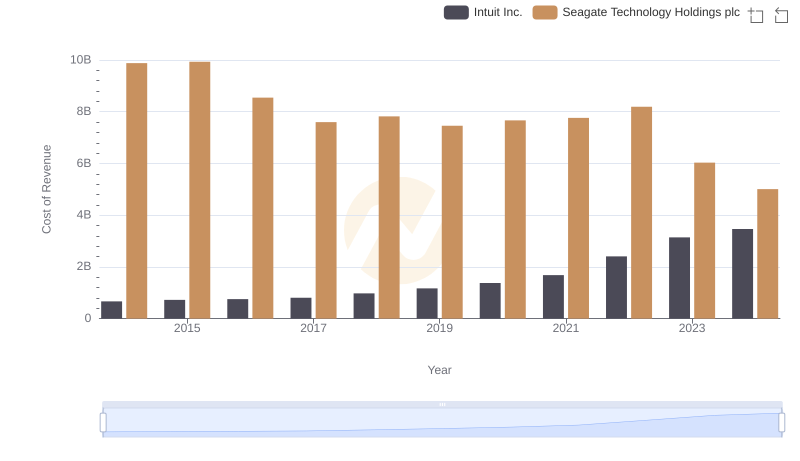
Cost Insights: Breaking Down Intuit Inc. and Seagate Technology Holdings plc's Expenses
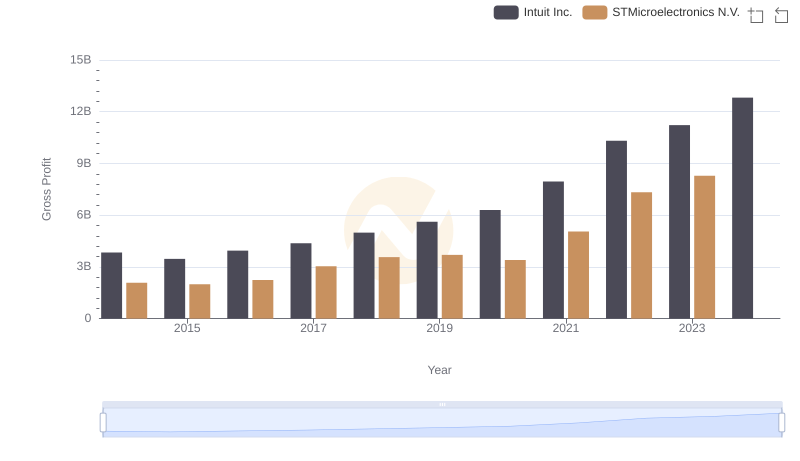
Gross Profit Analysis: Comparing Intuit Inc. and STMicroelectronics N.V.
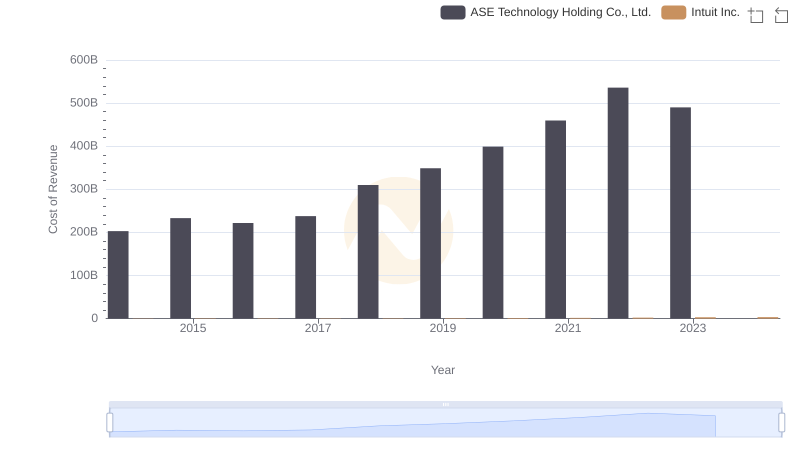
Cost of Revenue Comparison: Intuit Inc. vs ASE Technology Holding Co., Ltd.
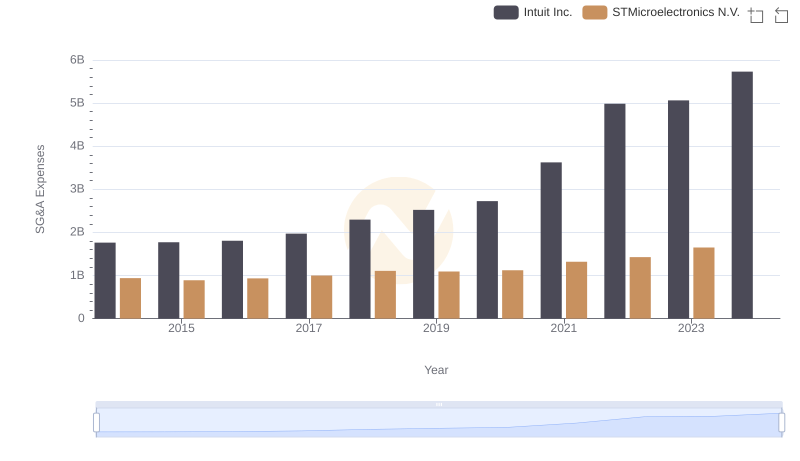
Cost Management Insights: SG&A Expenses for Intuit Inc. and STMicroelectronics N.V.
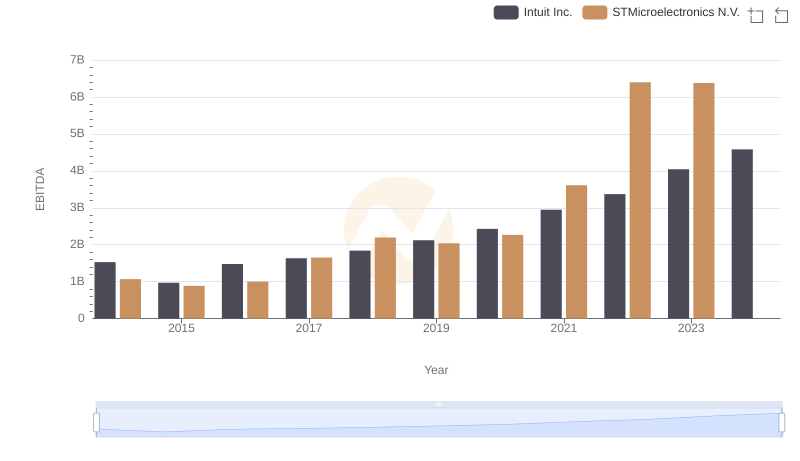
EBITDA Analysis: Evaluating Intuit Inc. Against STMicroelectronics N.V.