| __timestamp | Saia, Inc. | United Rentals, Inc. |
|---|---|---|
| Wednesday, January 1, 2014 | 37563000 | 758000000 |
| Thursday, January 1, 2015 | 26832000 | 714000000 |
| Friday, January 1, 2016 | 39625000 | 719000000 |
| Sunday, January 1, 2017 | 37162000 | 903000000 |
| Monday, January 1, 2018 | 38425000 | 1038000000 |
| Tuesday, January 1, 2019 | 43073000 | 1092000000 |
| Wednesday, January 1, 2020 | 49761000 | 979000000 |
| Friday, January 1, 2021 | 61345000 | 1199000000 |
| Saturday, January 1, 2022 | 56601000 | 1400000000 |
| Sunday, January 1, 2023 | 67984000 | 1527000000 |
| Monday, January 1, 2024 | 1645000000 |
Unleashing the power of data
In the competitive landscape of the U.S. stock market, understanding the financial health of companies is crucial. This analysis delves into the Selling, General, and Administrative (SG&A) expenses of United Rentals, Inc. and Saia, Inc. over the past decade. From 2014 to 2023, United Rentals has consistently outpaced Saia, with SG&A expenses growing by approximately 101%, reaching a peak of $1.53 billion in 2023. In contrast, Saia's expenses have increased by about 82%, culminating in $67.98 million in the same year. This disparity highlights United Rentals' expansive operational scale compared to Saia. Notably, 2024 data for Saia is missing, indicating potential reporting delays or strategic shifts. As investors and analysts, these insights into SG&A trends provide a window into each company's operational efficiency and strategic priorities.

Breaking Down Revenue Trends: United Rentals, Inc. vs Saia, Inc.
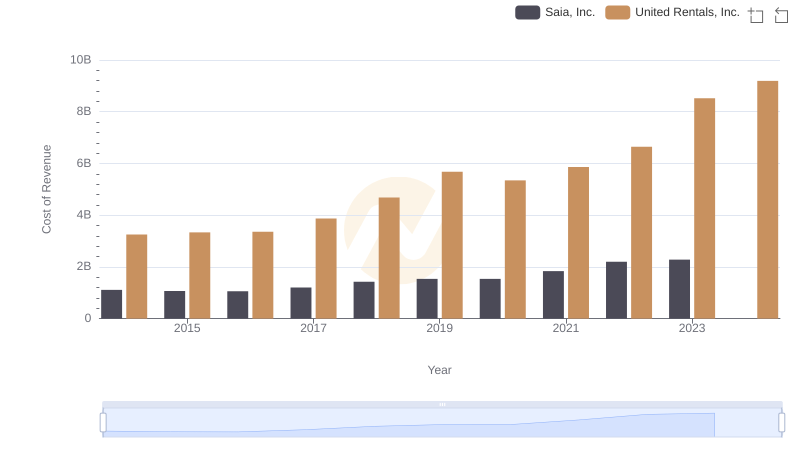
Cost of Revenue Comparison: United Rentals, Inc. vs Saia, Inc.
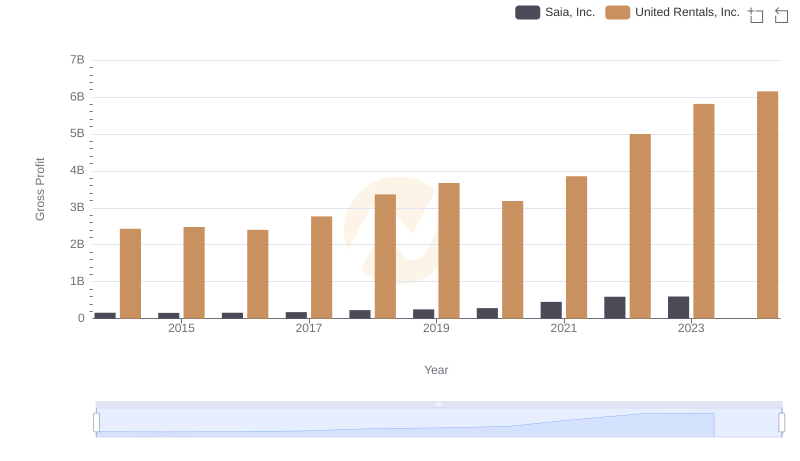
Gross Profit Comparison: United Rentals, Inc. and Saia, Inc. Trends
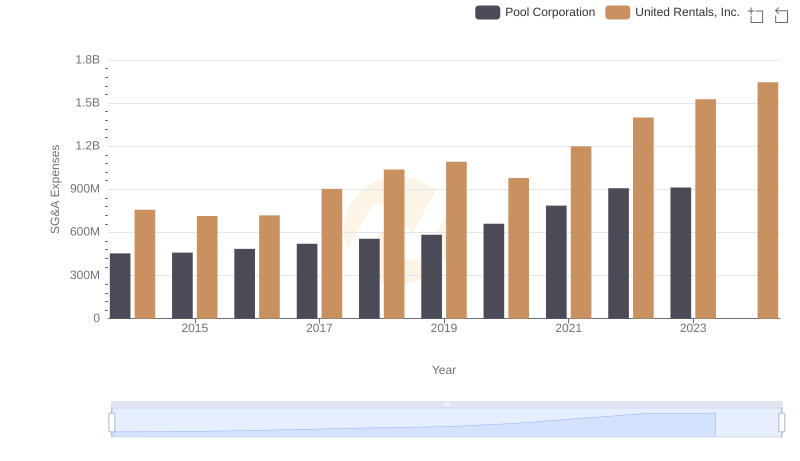
Cost Management Insights: SG&A Expenses for United Rentals, Inc. and Pool Corporation
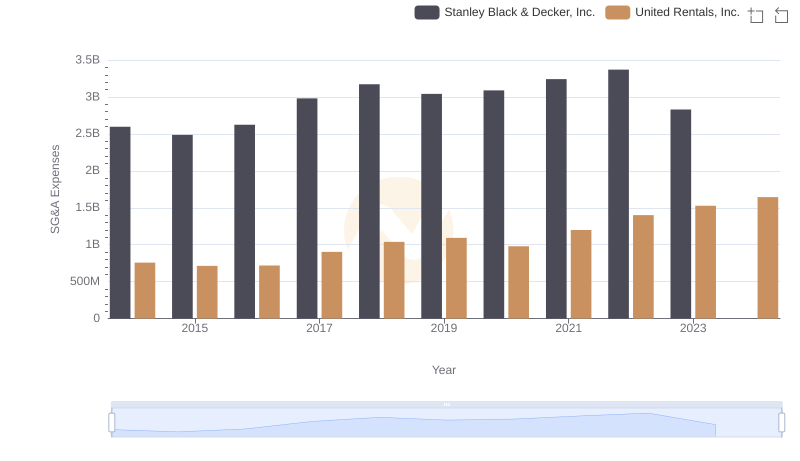
Cost Management Insights: SG&A Expenses for United Rentals, Inc. and Stanley Black & Decker, Inc.
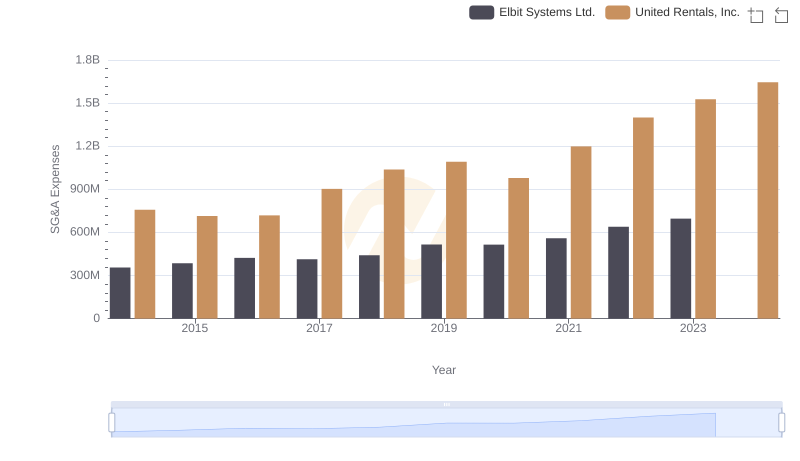
Operational Costs Compared: SG&A Analysis of United Rentals, Inc. and Elbit Systems Ltd.
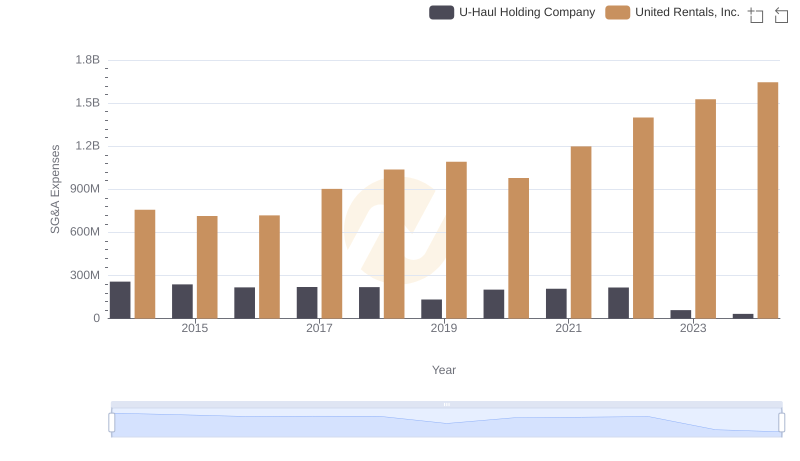
Comparing SG&A Expenses: United Rentals, Inc. vs U-Haul Holding Company Trends and Insights
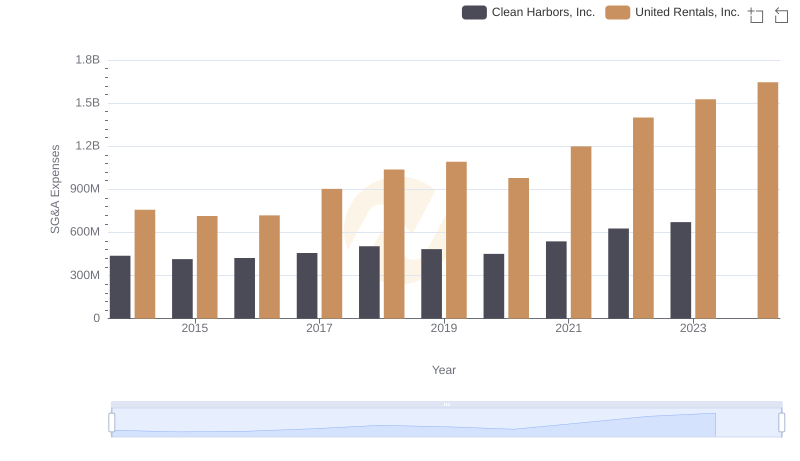
Operational Costs Compared: SG&A Analysis of United Rentals, Inc. and Clean Harbors, Inc.
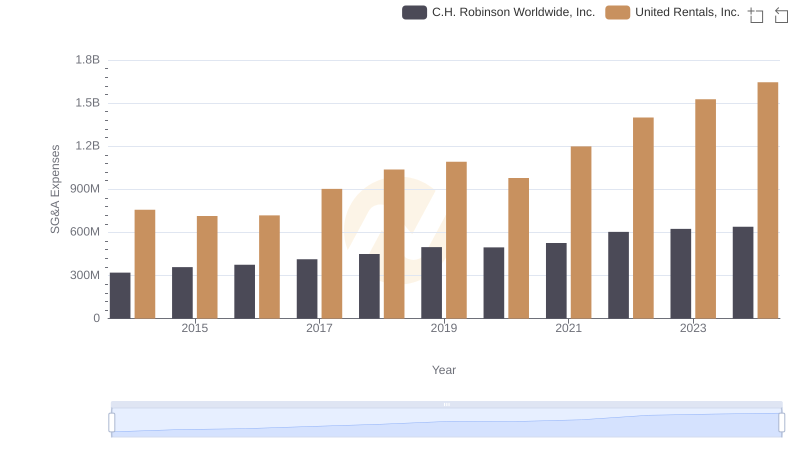
United Rentals, Inc. and C.H. Robinson Worldwide, Inc.: SG&A Spending Patterns Compared

Comparing SG&A Expenses: United Rentals, Inc. vs Curtiss-Wright Corporation Trends and Insights
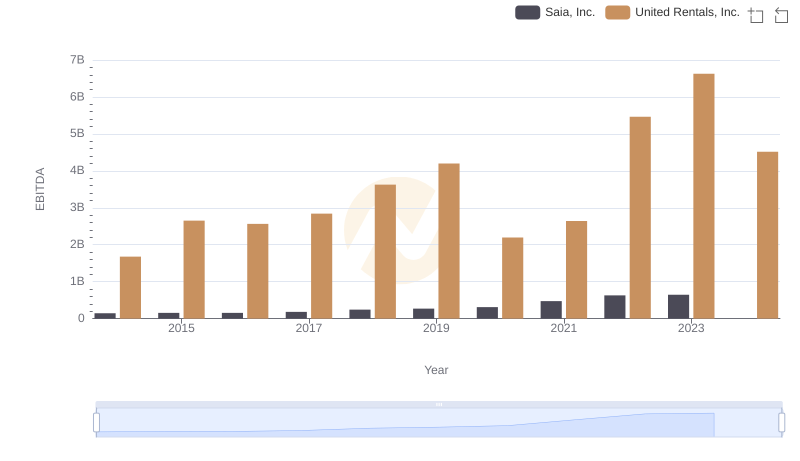
United Rentals, Inc. vs Saia, Inc.: In-Depth EBITDA Performance Comparison