| __timestamp | Pool Corporation | United Rentals, Inc. |
|---|---|---|
| Wednesday, January 1, 2014 | 454470000 | 758000000 |
| Thursday, January 1, 2015 | 459422000 | 714000000 |
| Friday, January 1, 2016 | 485228000 | 719000000 |
| Sunday, January 1, 2017 | 520918000 | 903000000 |
| Monday, January 1, 2018 | 556284000 | 1038000000 |
| Tuesday, January 1, 2019 | 583679000 | 1092000000 |
| Wednesday, January 1, 2020 | 659931000 | 979000000 |
| Friday, January 1, 2021 | 786808000 | 1199000000 |
| Saturday, January 1, 2022 | 907629000 | 1400000000 |
| Sunday, January 1, 2023 | 912927000 | 1527000000 |
| Monday, January 1, 2024 | 1645000000 |
Unleashing insights
In the dynamic world of corporate finance, managing Selling, General, and Administrative (SG&A) expenses is crucial for maintaining profitability. United Rentals, Inc. and Pool Corporation, two industry leaders, have demonstrated contrasting trends in their SG&A expenses over the past decade.
From 2014 to 2023, United Rentals, Inc. saw a steady increase in SG&A expenses, peaking at approximately 1.53 billion in 2023, marking a 102% rise from 2014. This upward trajectory reflects their aggressive expansion and strategic investments. In contrast, Pool Corporation's SG&A expenses grew by 101% over the same period, reaching around 913 million in 2023.
Interestingly, while both companies experienced growth, United Rentals, Inc. consistently outpaced Pool Corporation, highlighting their differing operational strategies. As we look to 2024, United Rentals, Inc. continues to project growth, while Pool Corporation's data remains elusive, leaving room for speculation.
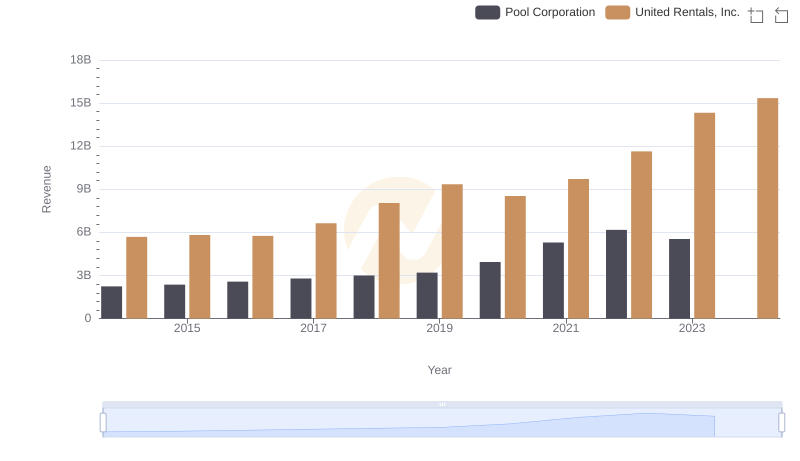
Annual Revenue Comparison: United Rentals, Inc. vs Pool Corporation
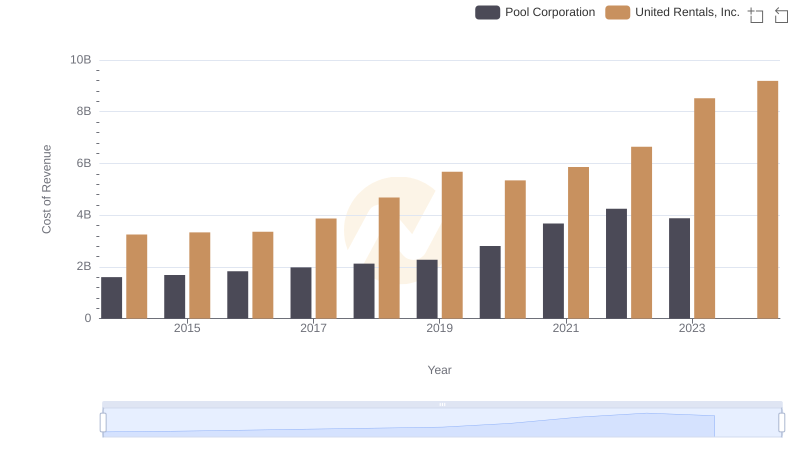
United Rentals, Inc. vs Pool Corporation: Efficiency in Cost of Revenue Explored
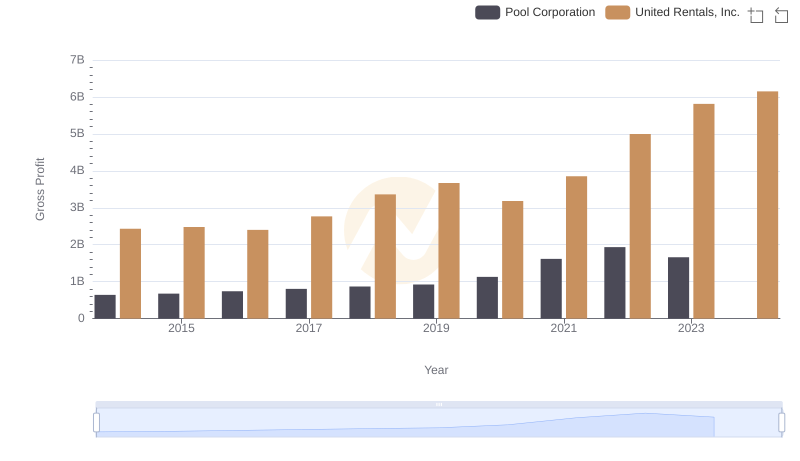
United Rentals, Inc. vs Pool Corporation: A Gross Profit Performance Breakdown
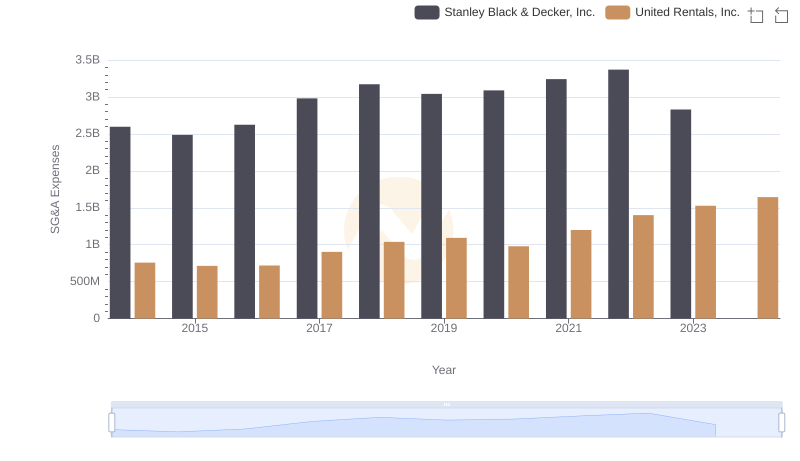
Cost Management Insights: SG&A Expenses for United Rentals, Inc. and Stanley Black & Decker, Inc.
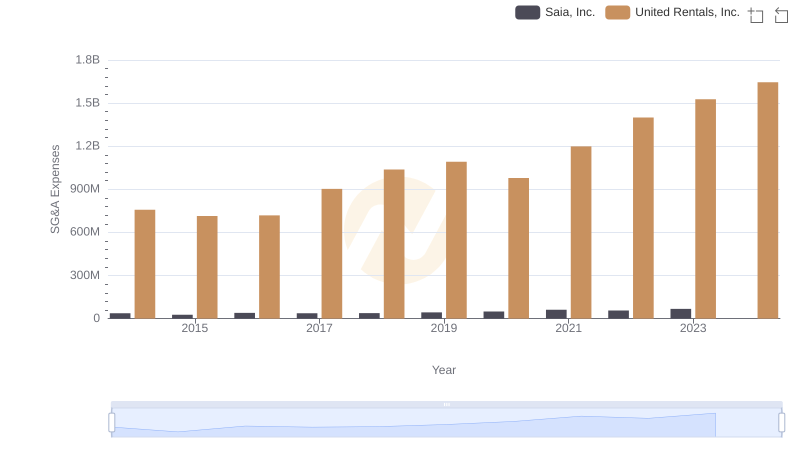
Breaking Down SG&A Expenses: United Rentals, Inc. vs Saia, Inc.
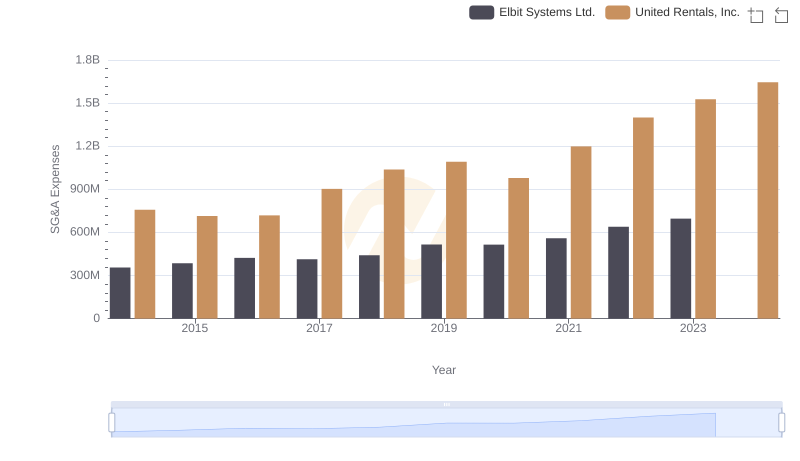
Operational Costs Compared: SG&A Analysis of United Rentals, Inc. and Elbit Systems Ltd.
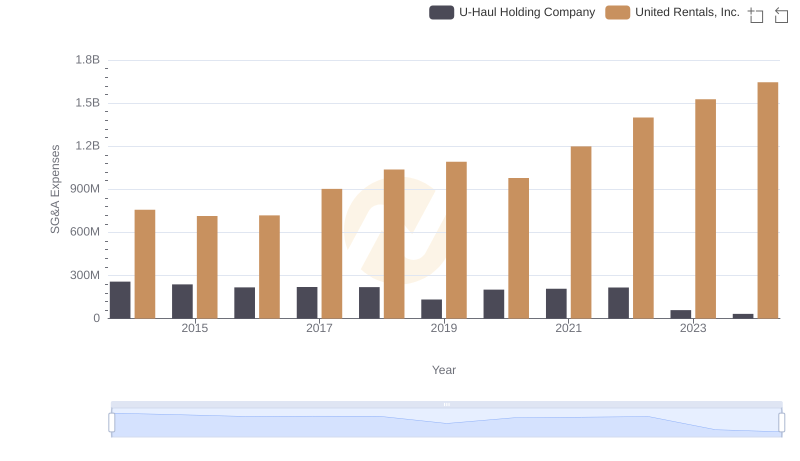
Comparing SG&A Expenses: United Rentals, Inc. vs U-Haul Holding Company Trends and Insights
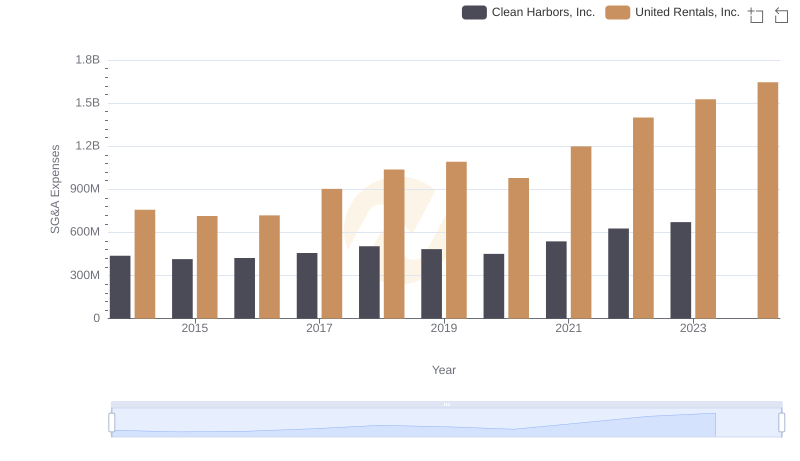
Operational Costs Compared: SG&A Analysis of United Rentals, Inc. and Clean Harbors, Inc.
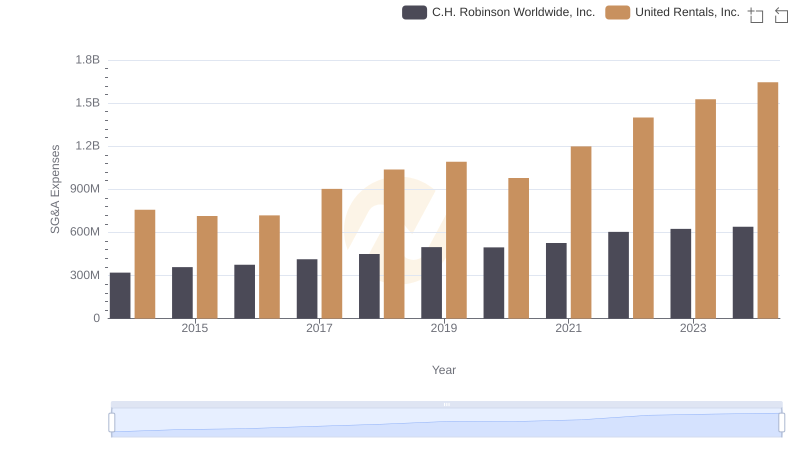
United Rentals, Inc. and C.H. Robinson Worldwide, Inc.: SG&A Spending Patterns Compared
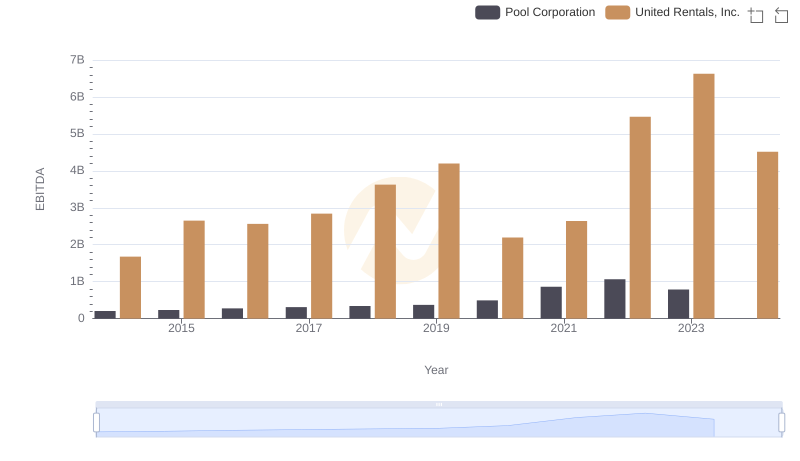
Comparative EBITDA Analysis: United Rentals, Inc. vs Pool Corporation

Comparing SG&A Expenses: United Rentals, Inc. vs Curtiss-Wright Corporation Trends and Insights