| __timestamp | Elbit Systems Ltd. | United Rentals, Inc. |
|---|---|---|
| Wednesday, January 1, 2014 | 356171000 | 758000000 |
| Thursday, January 1, 2015 | 385059000 | 714000000 |
| Friday, January 1, 2016 | 422390000 | 719000000 |
| Sunday, January 1, 2017 | 413560000 | 903000000 |
| Monday, January 1, 2018 | 441362000 | 1038000000 |
| Tuesday, January 1, 2019 | 516149000 | 1092000000 |
| Wednesday, January 1, 2020 | 514638000 | 979000000 |
| Friday, January 1, 2021 | 559113000 | 1199000000 |
| Saturday, January 1, 2022 | 639067000 | 1400000000 |
| Sunday, January 1, 2023 | 696022000 | 1527000000 |
| Monday, January 1, 2024 | 1645000000 |
Unveiling the hidden dimensions of data
In the ever-evolving landscape of corporate finance, understanding operational costs is crucial. This analysis delves into the Selling, General, and Administrative (SG&A) expenses of two industry giants: United Rentals, Inc. and Elbit Systems Ltd., from 2014 to 2023. Over this decade, United Rentals consistently outpaced Elbit Systems in SG&A expenses, with a notable 40% higher average. By 2023, United Rentals' expenses surged to 1.53 billion, marking a 101% increase from 2014, while Elbit Systems saw a 95% rise, reaching 696 million. This trend highlights United Rentals' aggressive expansion and operational scale. However, the data for 2024 is incomplete, leaving room for speculation on future trajectories. As businesses navigate post-pandemic challenges, these insights offer a window into strategic financial management.
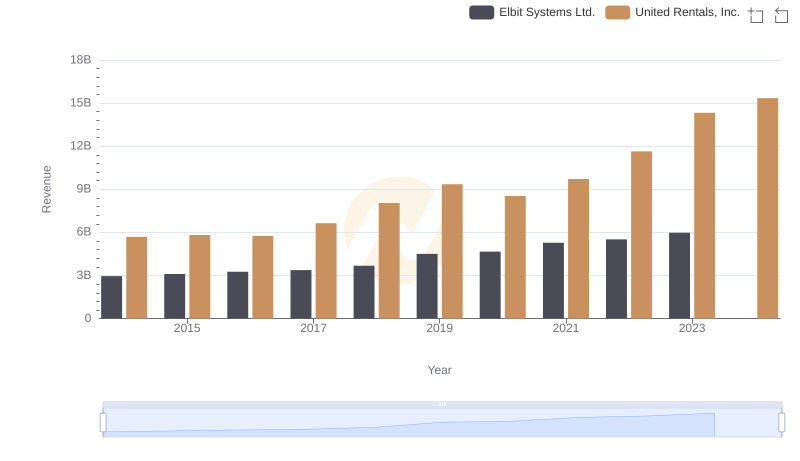
Breaking Down Revenue Trends: United Rentals, Inc. vs Elbit Systems Ltd.
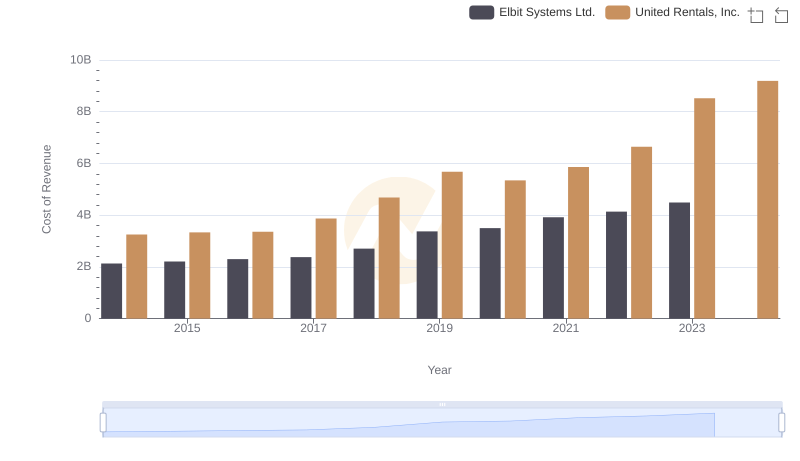
Comparing Cost of Revenue Efficiency: United Rentals, Inc. vs Elbit Systems Ltd.
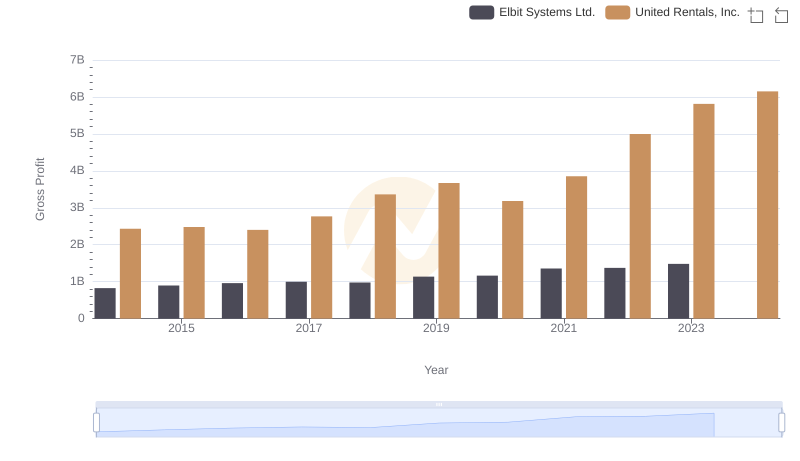
Gross Profit Analysis: Comparing United Rentals, Inc. and Elbit Systems Ltd.
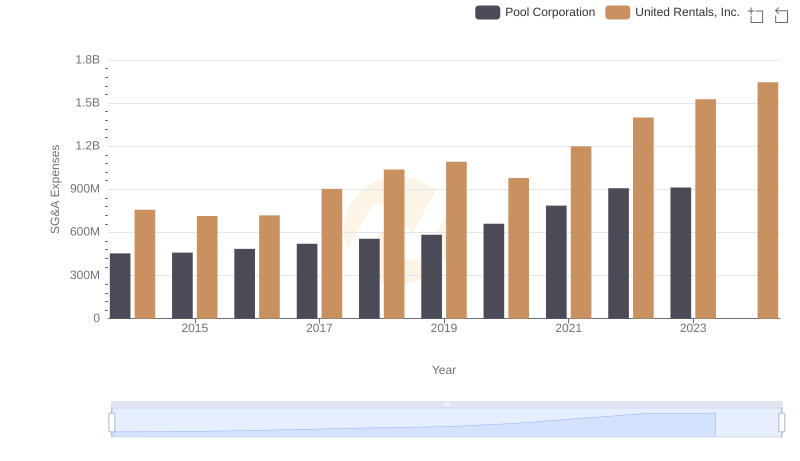
Cost Management Insights: SG&A Expenses for United Rentals, Inc. and Pool Corporation
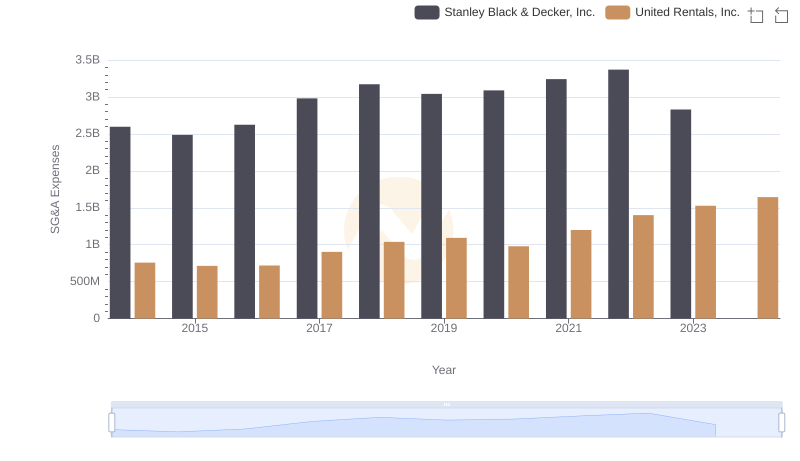
Cost Management Insights: SG&A Expenses for United Rentals, Inc. and Stanley Black & Decker, Inc.
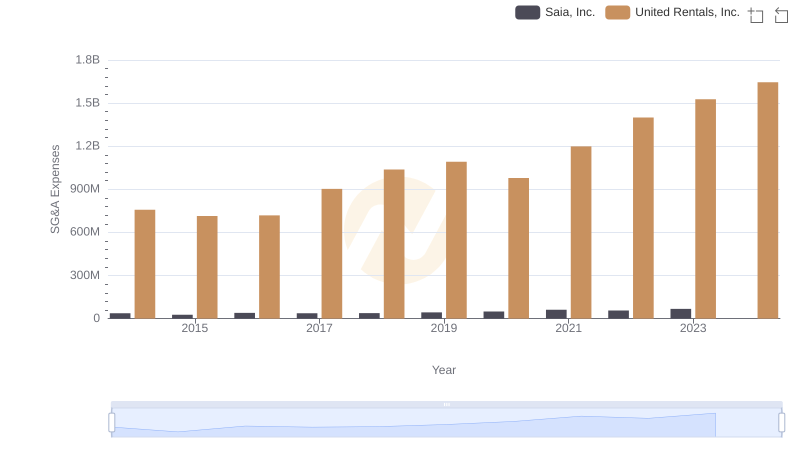
Breaking Down SG&A Expenses: United Rentals, Inc. vs Saia, Inc.
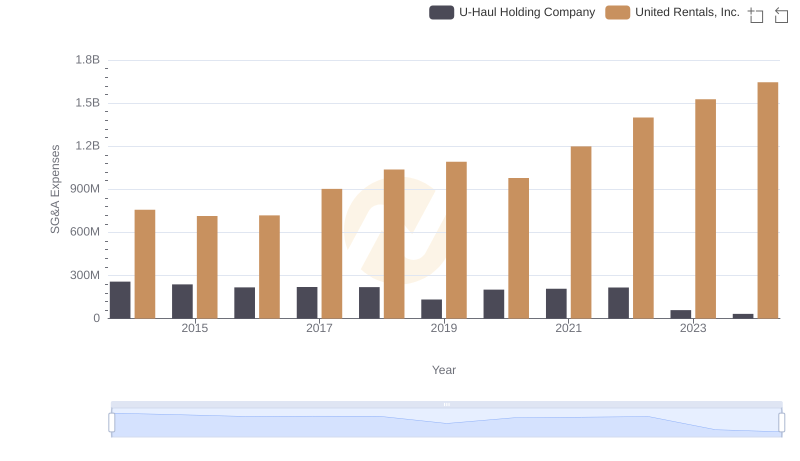
Comparing SG&A Expenses: United Rentals, Inc. vs U-Haul Holding Company Trends and Insights
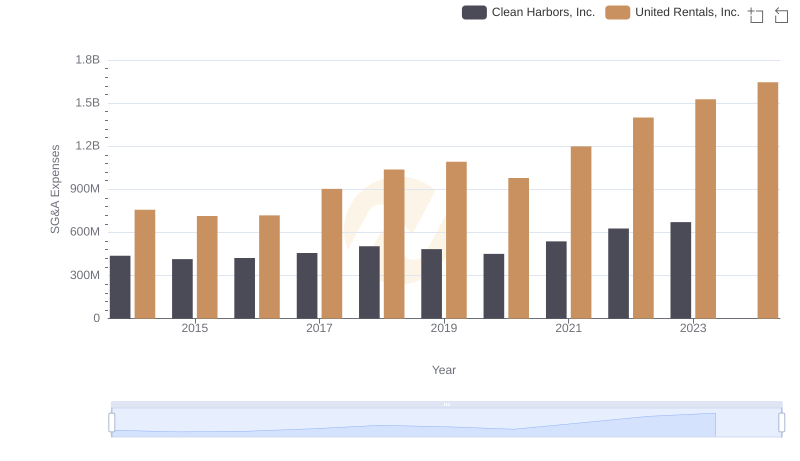
Operational Costs Compared: SG&A Analysis of United Rentals, Inc. and Clean Harbors, Inc.
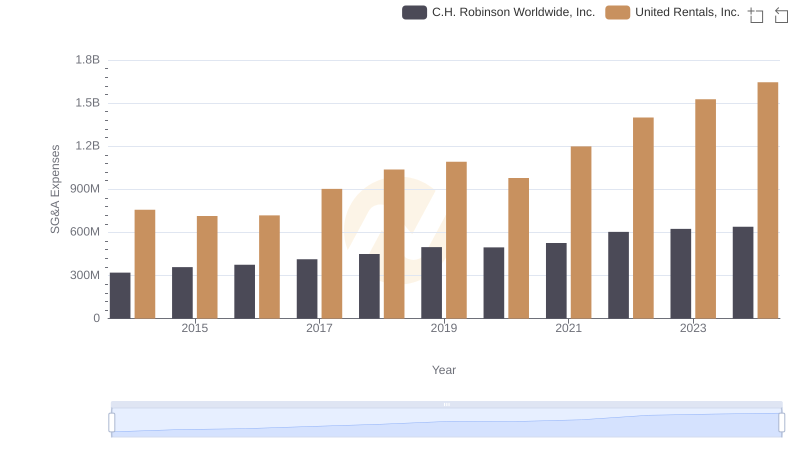
United Rentals, Inc. and C.H. Robinson Worldwide, Inc.: SG&A Spending Patterns Compared

Comparing SG&A Expenses: United Rentals, Inc. vs Curtiss-Wright Corporation Trends and Insights
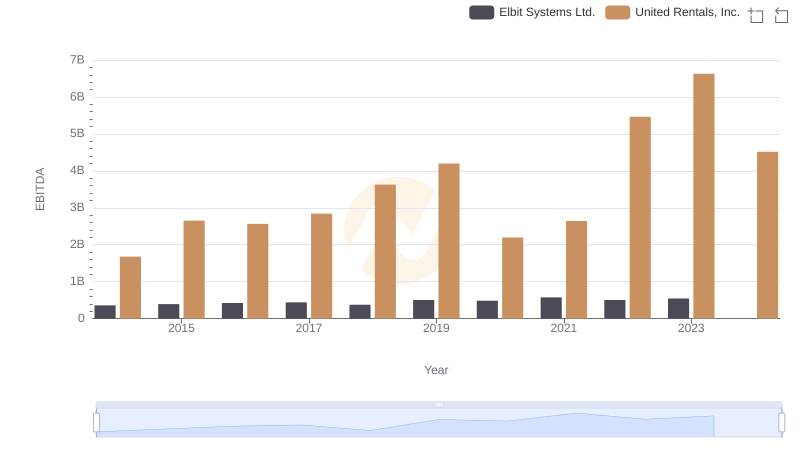
A Side-by-Side Analysis of EBITDA: United Rentals, Inc. and Elbit Systems Ltd.