| __timestamp | Snap-on Incorporated | United Rentals, Inc. |
|---|---|---|
| Wednesday, January 1, 2014 | 1693400000 | 3253000000 |
| Thursday, January 1, 2015 | 1704500000 | 3337000000 |
| Friday, January 1, 2016 | 1720800000 | 3359000000 |
| Sunday, January 1, 2017 | 1862000000 | 3872000000 |
| Monday, January 1, 2018 | 1870700000 | 4683000000 |
| Tuesday, January 1, 2019 | 1886000000 | 5681000000 |
| Wednesday, January 1, 2020 | 1844000000 | 5347000000 |
| Friday, January 1, 2021 | 2141200000 | 5863000000 |
| Saturday, January 1, 2022 | 2311700000 | 6646000000 |
| Sunday, January 1, 2023 | 2488500000 | 8519000000 |
| Monday, January 1, 2024 | 2329500000 | 9195000000 |
Cracking the code
In the ever-evolving landscape of industrial equipment and tools, understanding cost structures is pivotal. United Rentals, Inc. and Snap-on Incorporated, two titans in their respective fields, showcase intriguing cost trends over the past decade. From 2014 to 2023, United Rentals' cost of revenue surged by approximately 162%, reflecting its aggressive expansion and market dominance. In contrast, Snap-on's cost of revenue grew by about 47%, indicating a more stable growth trajectory.
United Rentals consistently outpaced Snap-on, with costs peaking at $8.52 billion in 2023, compared to Snap-on's $2.49 billion. This disparity highlights United Rentals' larger scale and operational breadth. However, the data for 2024 reveals a gap for Snap-on, suggesting potential strategic shifts or reporting delays. As these companies navigate economic fluctuations, their cost strategies will be crucial in maintaining competitive edges.
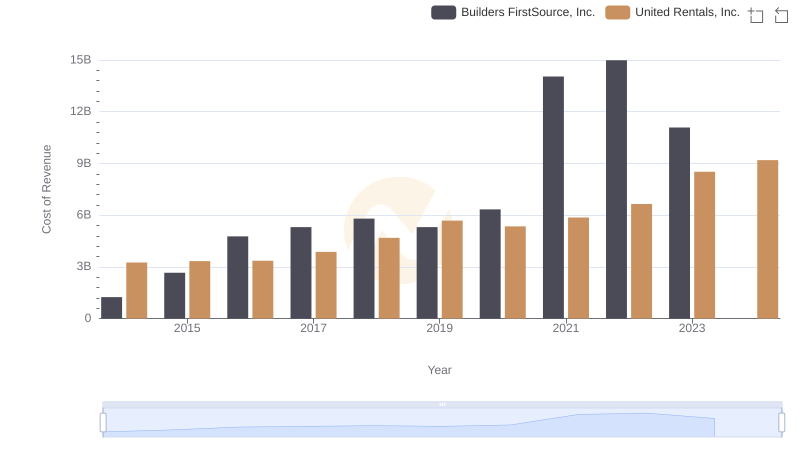
Cost Insights: Breaking Down United Rentals, Inc. and Builders FirstSource, Inc.'s Expenses
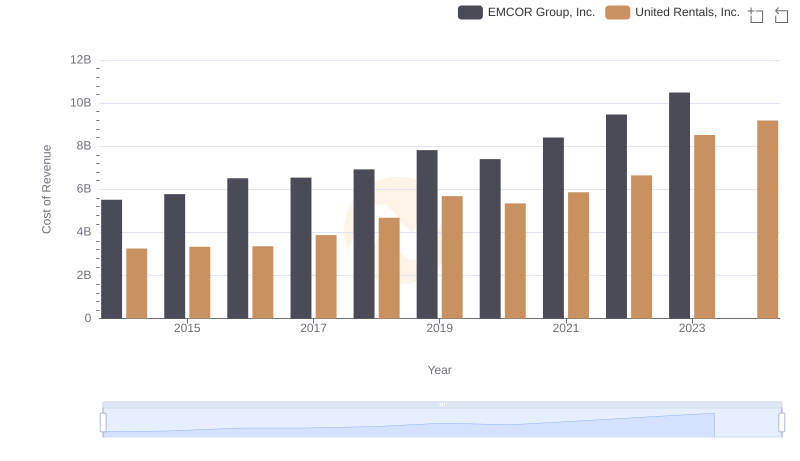
United Rentals, Inc. vs EMCOR Group, Inc.: Efficiency in Cost of Revenue Explored
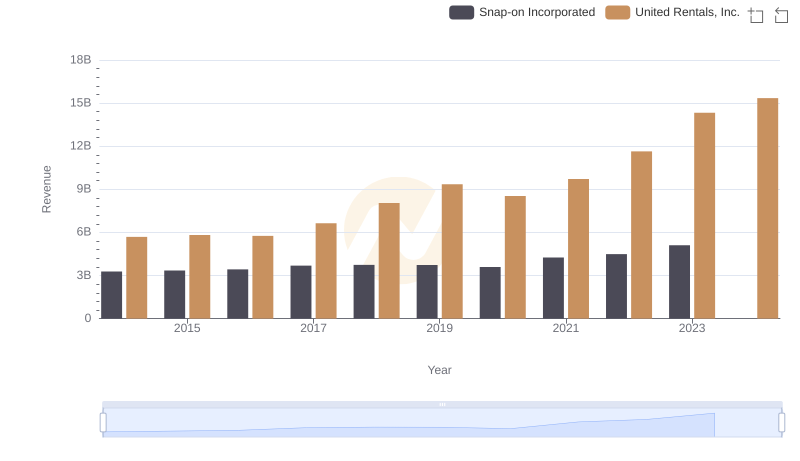
Breaking Down Revenue Trends: United Rentals, Inc. vs Snap-on Incorporated
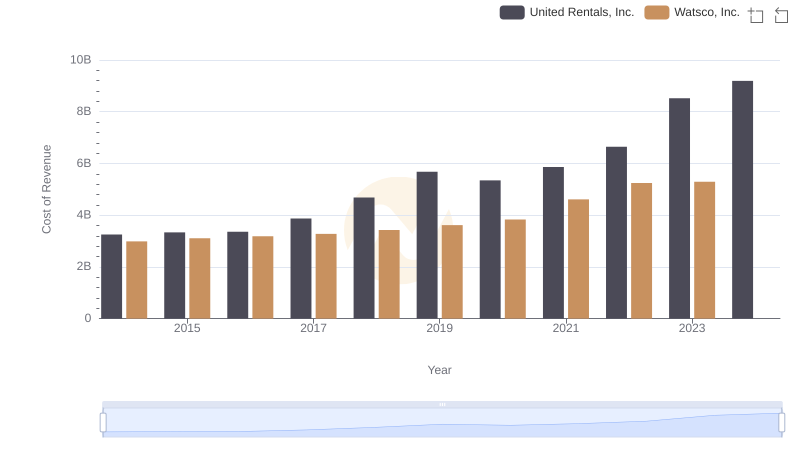
United Rentals, Inc. vs Watsco, Inc.: Efficiency in Cost of Revenue Explored
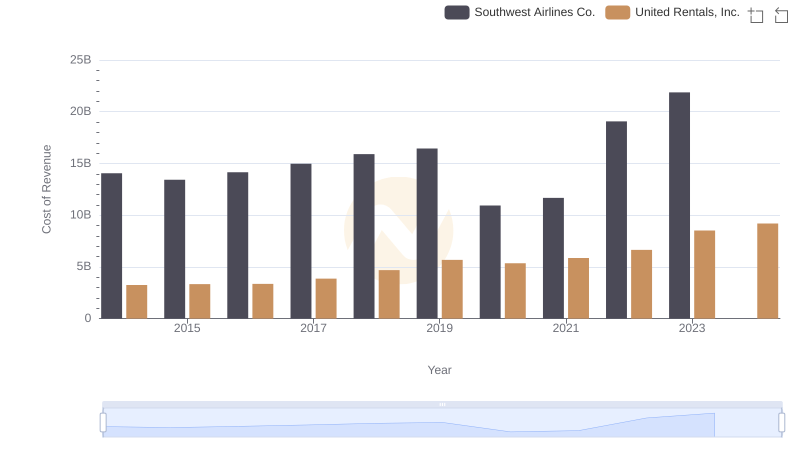
Cost Insights: Breaking Down United Rentals, Inc. and Southwest Airlines Co.'s Expenses
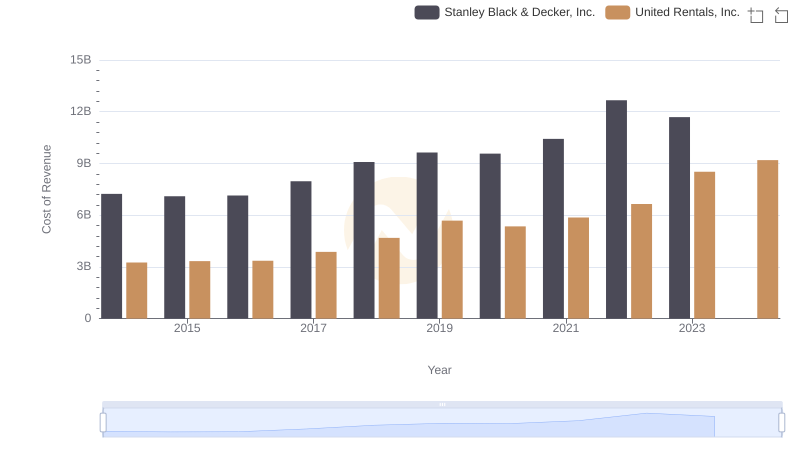
Cost of Revenue Comparison: United Rentals, Inc. vs Stanley Black & Decker, Inc.
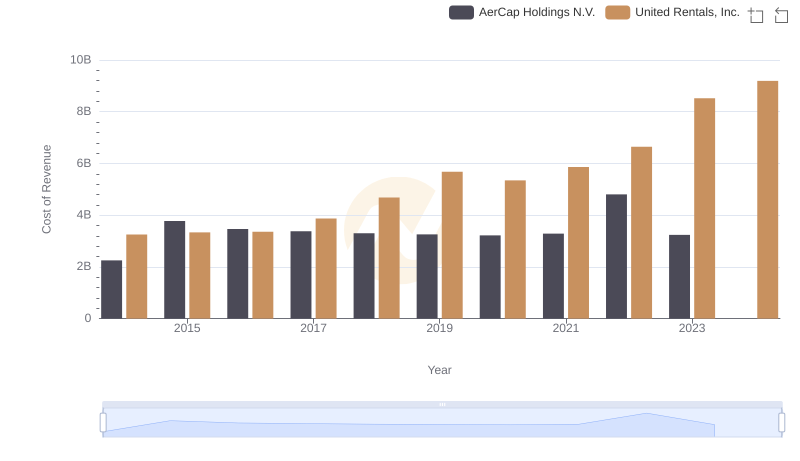
Cost Insights: Breaking Down United Rentals, Inc. and AerCap Holdings N.V.'s Expenses
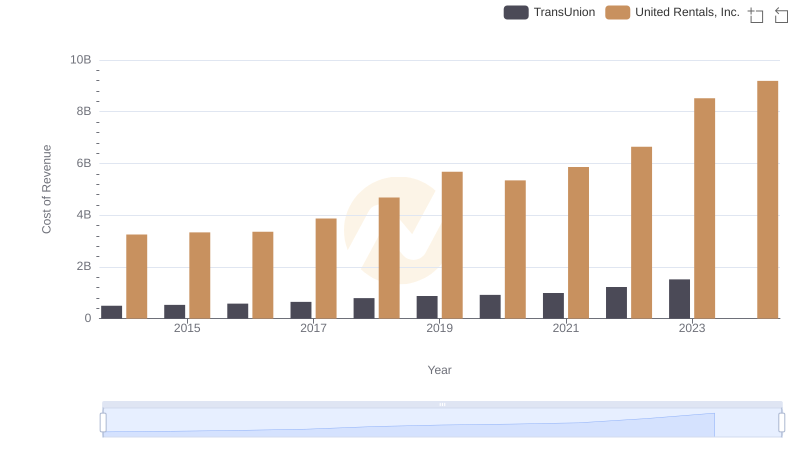
Cost of Revenue: Key Insights for United Rentals, Inc. and TransUnion
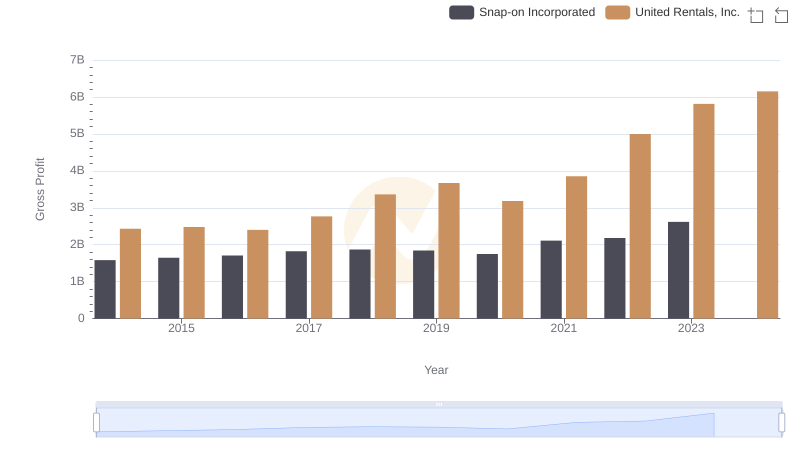
Gross Profit Analysis: Comparing United Rentals, Inc. and Snap-on Incorporated
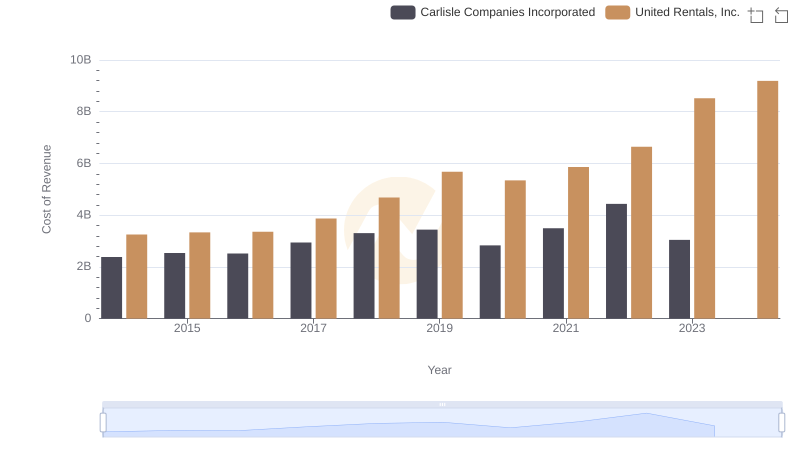
Analyzing Cost of Revenue: United Rentals, Inc. and Carlisle Companies Incorporated
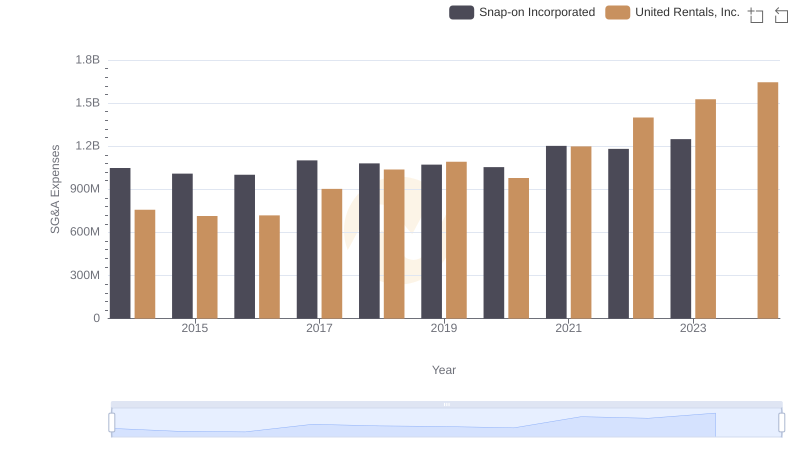
United Rentals, Inc. and Snap-on Incorporated: SG&A Spending Patterns Compared
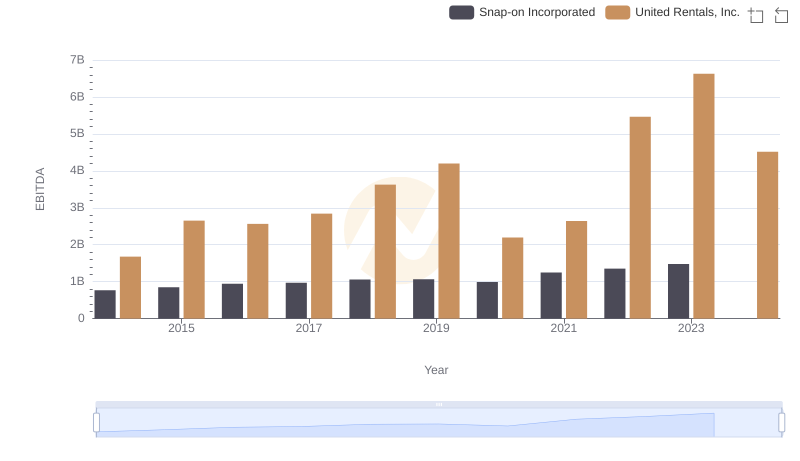
Comparative EBITDA Analysis: United Rentals, Inc. vs Snap-on Incorporated