| __timestamp | Carlisle Companies Incorporated | United Rentals, Inc. |
|---|---|---|
| Wednesday, January 1, 2014 | 2384500000 | 3253000000 |
| Thursday, January 1, 2015 | 2536500000 | 3337000000 |
| Friday, January 1, 2016 | 2518100000 | 3359000000 |
| Sunday, January 1, 2017 | 2941900000 | 3872000000 |
| Monday, January 1, 2018 | 3304800000 | 4683000000 |
| Tuesday, January 1, 2019 | 3439900000 | 5681000000 |
| Wednesday, January 1, 2020 | 2832500000 | 5347000000 |
| Friday, January 1, 2021 | 3495600000 | 5863000000 |
| Saturday, January 1, 2022 | 4434500000 | 6646000000 |
| Sunday, January 1, 2023 | 3042900000 | 8519000000 |
| Monday, January 1, 2024 | 3115900000 | 9195000000 |
Unveiling the hidden dimensions of data
In the ever-evolving landscape of industrial services, understanding cost dynamics is crucial. From 2014 to 2023, United Rentals, Inc. and Carlisle Companies Incorporated have shown distinct trajectories in their cost of revenue. United Rentals, a leader in equipment rental, has seen its cost of revenue grow by approximately 162%, peaking in 2023. This reflects its aggressive expansion and market penetration strategies. Meanwhile, Carlisle Companies, known for its diversified industrial products, experienced a more modest increase of around 28% over the same period, with a notable peak in 2022. The data suggests that United Rentals' cost management aligns with its growth ambitions, while Carlisle's steadier approach indicates a focus on efficiency. Notably, 2024 data for Carlisle is missing, hinting at potential shifts or reporting delays. These insights offer a window into the strategic priorities of these industrial giants.
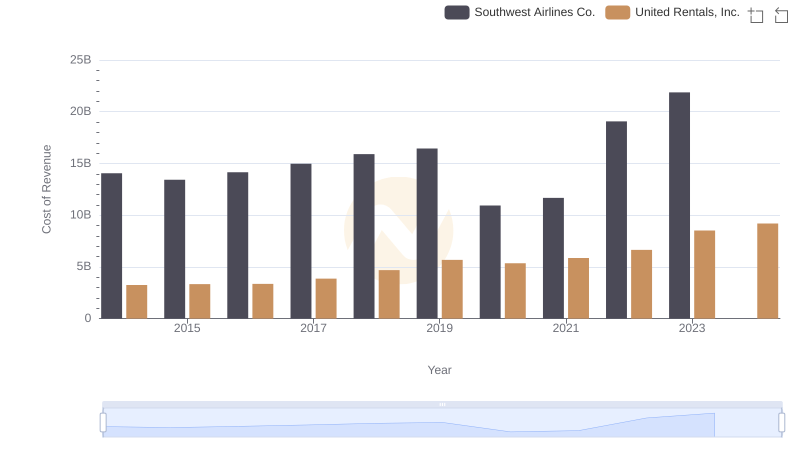
Cost Insights: Breaking Down United Rentals, Inc. and Southwest Airlines Co.'s Expenses
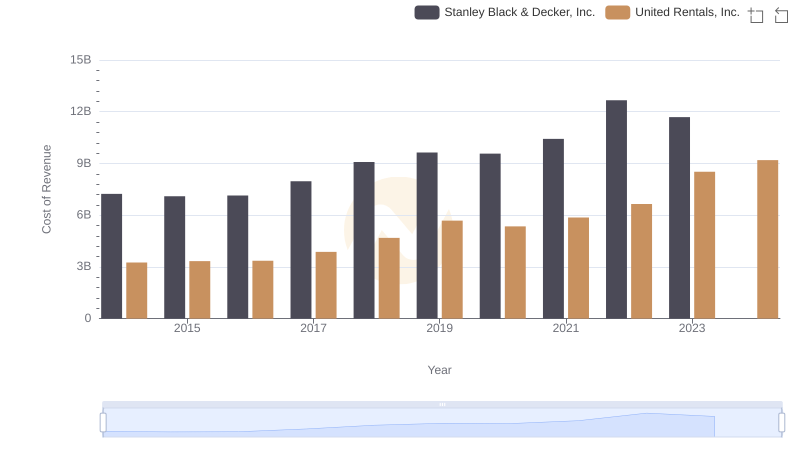
Cost of Revenue Comparison: United Rentals, Inc. vs Stanley Black & Decker, Inc.
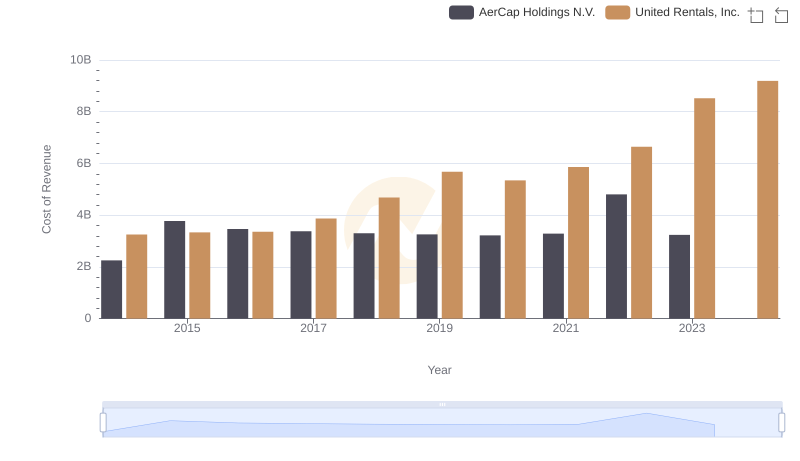
Cost Insights: Breaking Down United Rentals, Inc. and AerCap Holdings N.V.'s Expenses
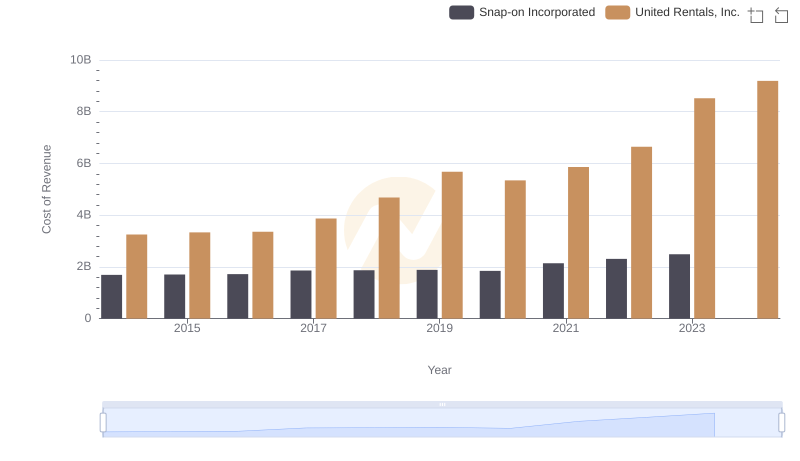
Cost Insights: Breaking Down United Rentals, Inc. and Snap-on Incorporated's Expenses
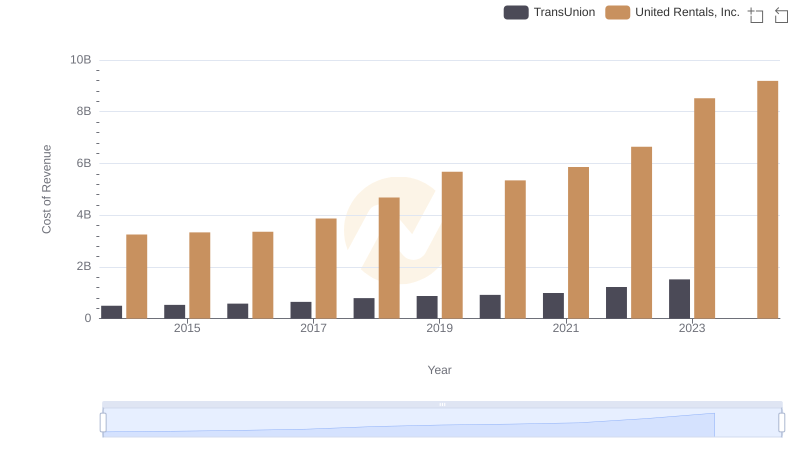
Cost of Revenue: Key Insights for United Rentals, Inc. and TransUnion
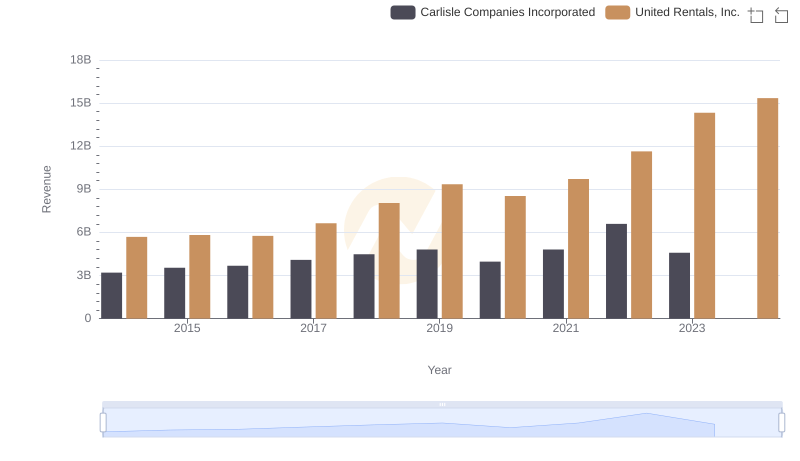
Annual Revenue Comparison: United Rentals, Inc. vs Carlisle Companies Incorporated
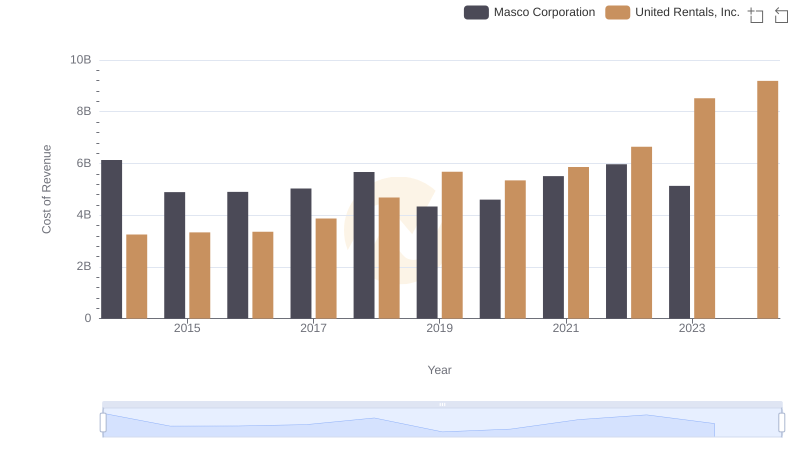
Comparing Cost of Revenue Efficiency: United Rentals, Inc. vs Masco Corporation
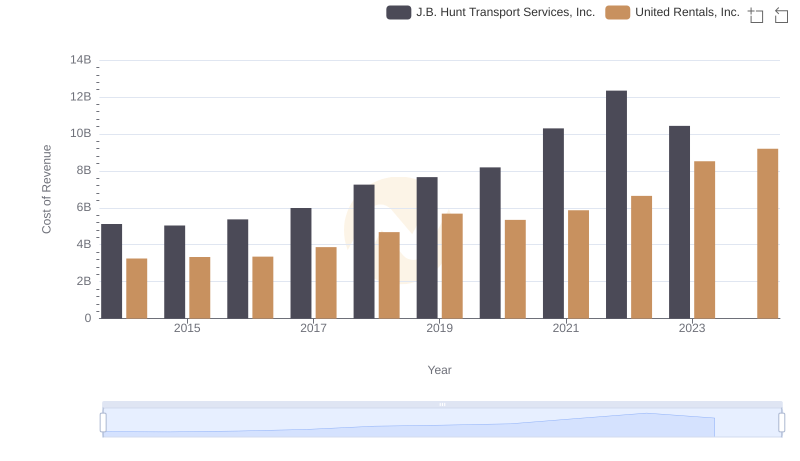
Cost of Revenue Comparison: United Rentals, Inc. vs J.B. Hunt Transport Services, Inc.
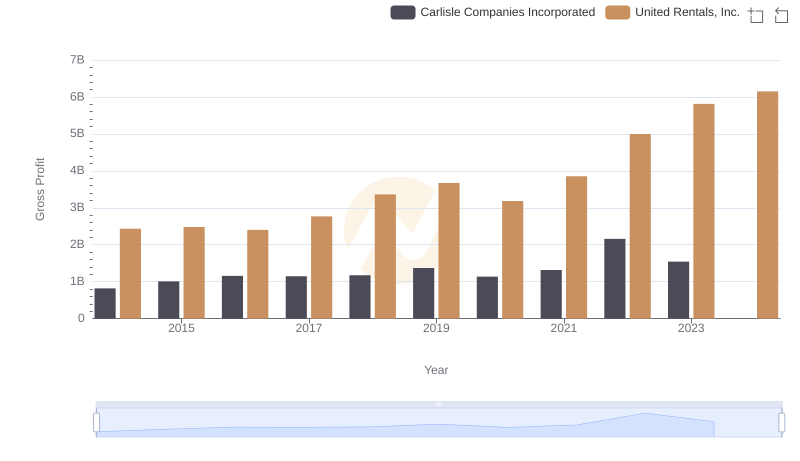
Gross Profit Comparison: United Rentals, Inc. and Carlisle Companies Incorporated Trends
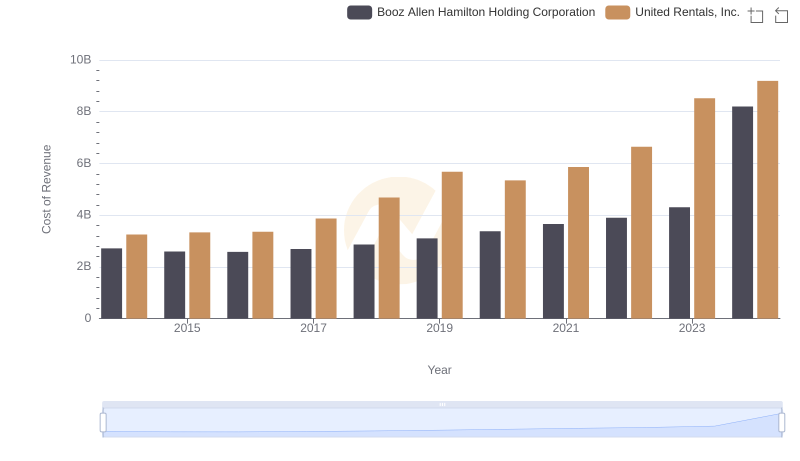
Cost of Revenue: Key Insights for United Rentals, Inc. and Booz Allen Hamilton Holding Corporation
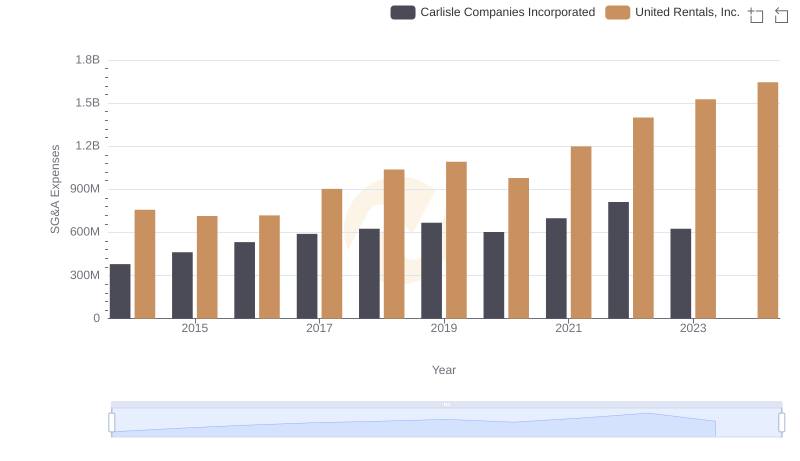
Who Optimizes SG&A Costs Better? United Rentals, Inc. or Carlisle Companies Incorporated
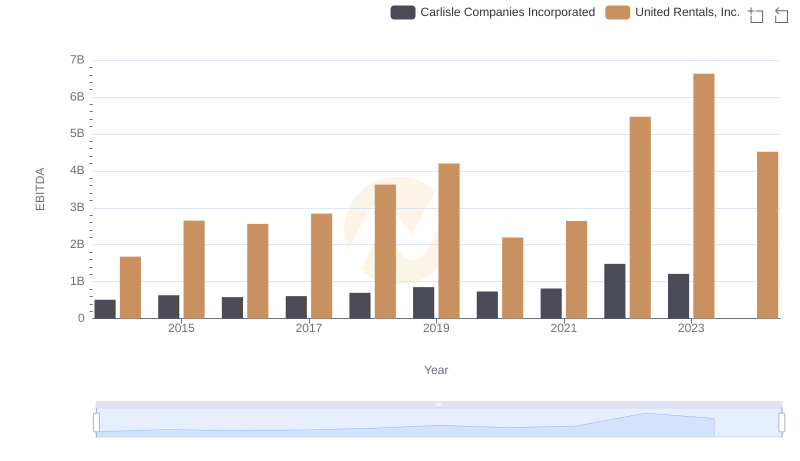
EBITDA Analysis: Evaluating United Rentals, Inc. Against Carlisle Companies Incorporated