| __timestamp | Snap-on Incorporated | United Rentals, Inc. |
|---|---|---|
| Wednesday, January 1, 2014 | 1584300000 | 2432000000 |
| Thursday, January 1, 2015 | 1648300000 | 2480000000 |
| Friday, January 1, 2016 | 1709600000 | 2403000000 |
| Sunday, January 1, 2017 | 1824900000 | 2769000000 |
| Monday, January 1, 2018 | 1870000000 | 3364000000 |
| Tuesday, January 1, 2019 | 1844000000 | 3670000000 |
| Wednesday, January 1, 2020 | 1748500000 | 3183000000 |
| Friday, January 1, 2021 | 2110800000 | 3853000000 |
| Saturday, January 1, 2022 | 2181100000 | 4996000000 |
| Sunday, January 1, 2023 | 2619800000 | 5813000000 |
| Monday, January 1, 2024 | 2377900000 | 6150000000 |
Unveiling the hidden dimensions of data
In the competitive landscape of industrial equipment, United Rentals, Inc. and Snap-on Incorporated have shown distinct trajectories in their gross profit over the past decade. From 2014 to 2023, United Rentals has consistently outperformed Snap-on, with a notable 139% increase in gross profit, peaking at approximately $5.8 billion in 2023. Snap-on, while experiencing a steady growth of around 65%, reached its highest gross profit of about $2.6 billion in the same year.
The data highlights a significant divergence in growth rates, with United Rentals expanding its gross profit at a faster pace. This trend underscores the company's strategic positioning and market expansion efforts. However, the data for 2024 is incomplete, leaving room for speculation on future performance. As these industry giants continue to evolve, stakeholders and investors should keep a keen eye on their financial health and market strategies.
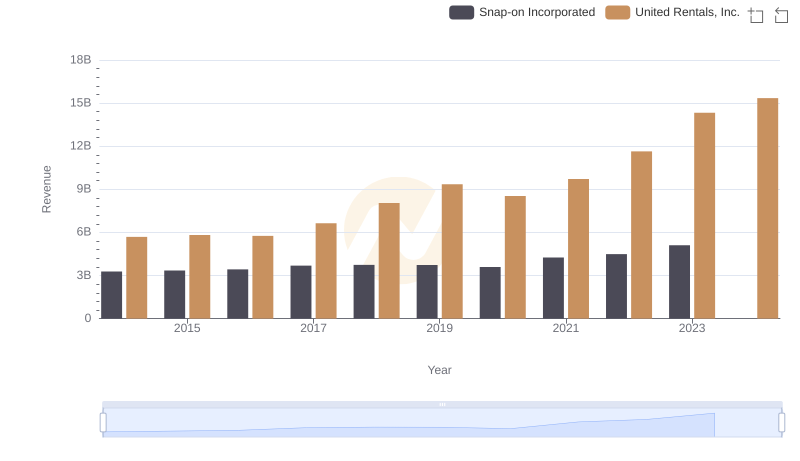
Breaking Down Revenue Trends: United Rentals, Inc. vs Snap-on Incorporated
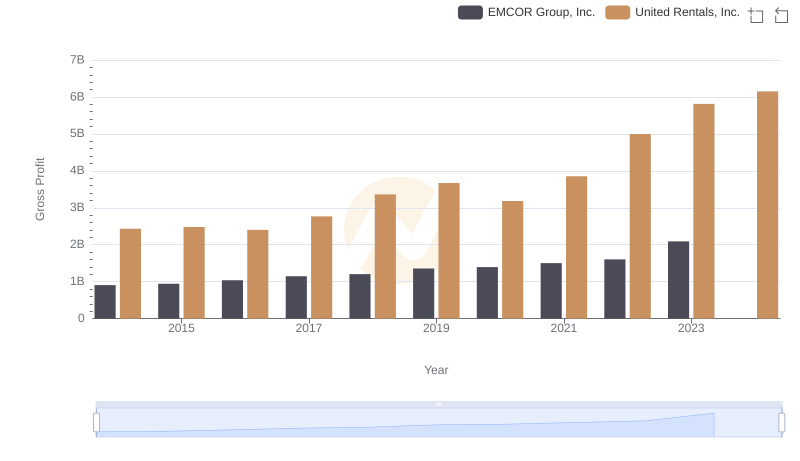
United Rentals, Inc. and EMCOR Group, Inc.: A Detailed Gross Profit Analysis
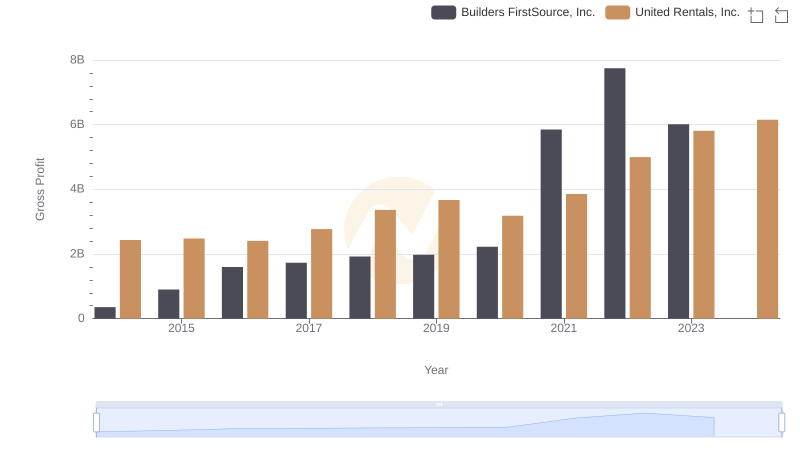
Gross Profit Comparison: United Rentals, Inc. and Builders FirstSource, Inc. Trends
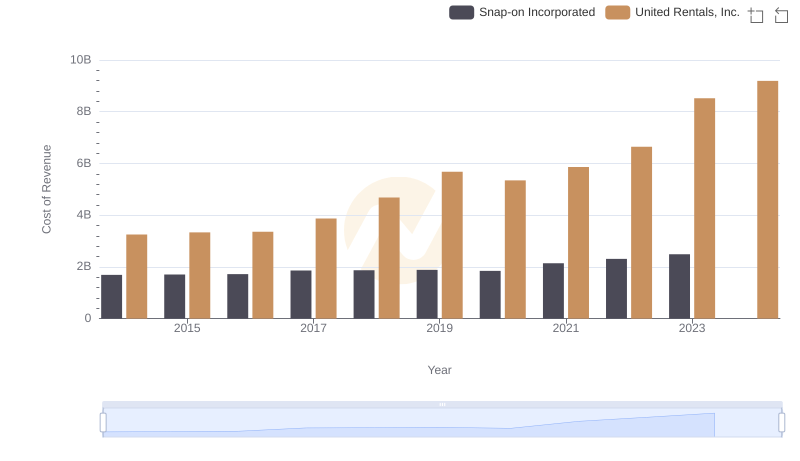
Cost Insights: Breaking Down United Rentals, Inc. and Snap-on Incorporated's Expenses
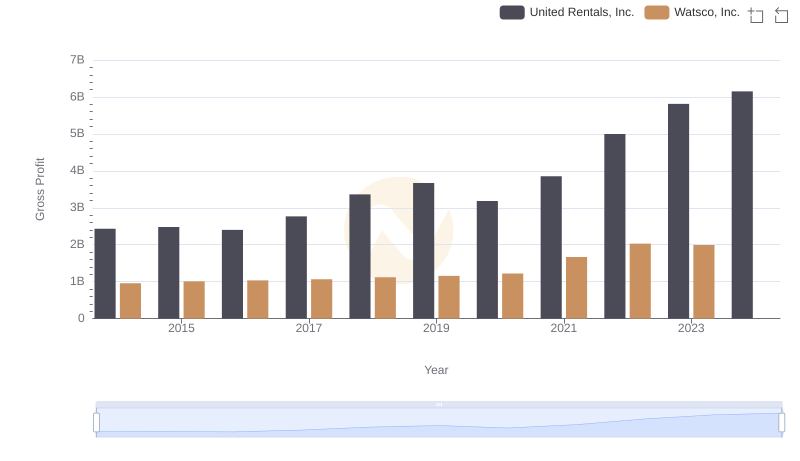
Gross Profit Analysis: Comparing United Rentals, Inc. and Watsco, Inc.
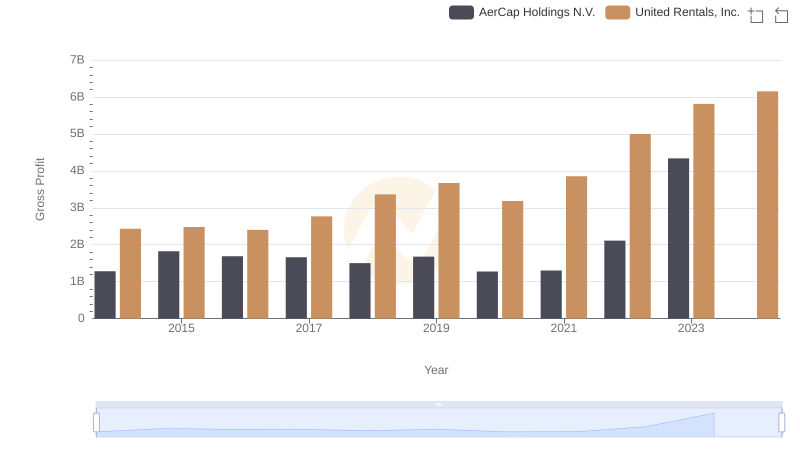
Gross Profit Analysis: Comparing United Rentals, Inc. and AerCap Holdings N.V.
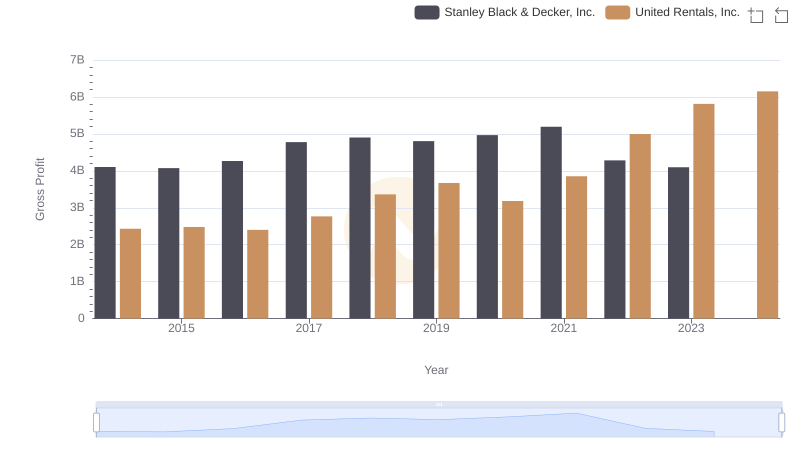
Gross Profit Analysis: Comparing United Rentals, Inc. and Stanley Black & Decker, Inc.
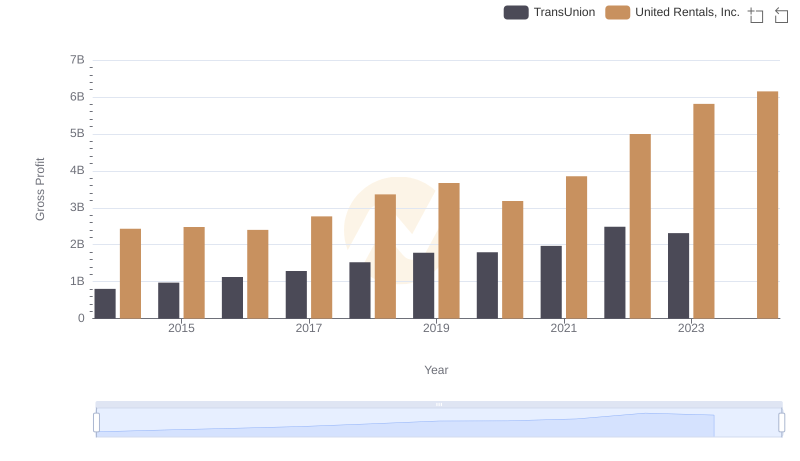
United Rentals, Inc. and TransUnion: A Detailed Gross Profit Analysis
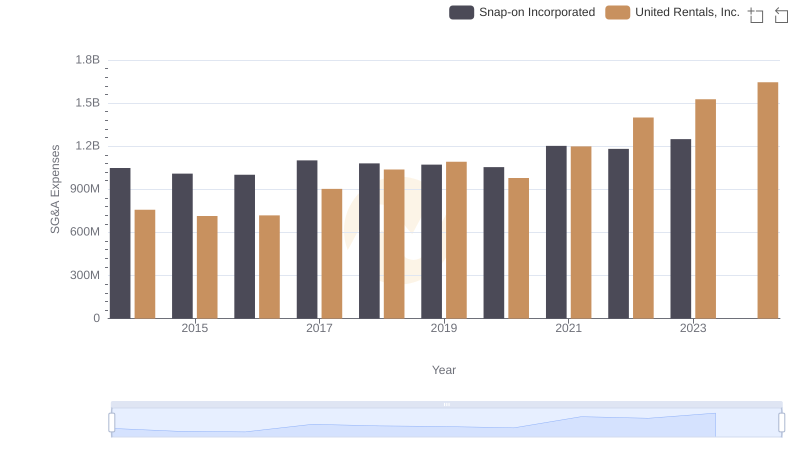
United Rentals, Inc. and Snap-on Incorporated: SG&A Spending Patterns Compared
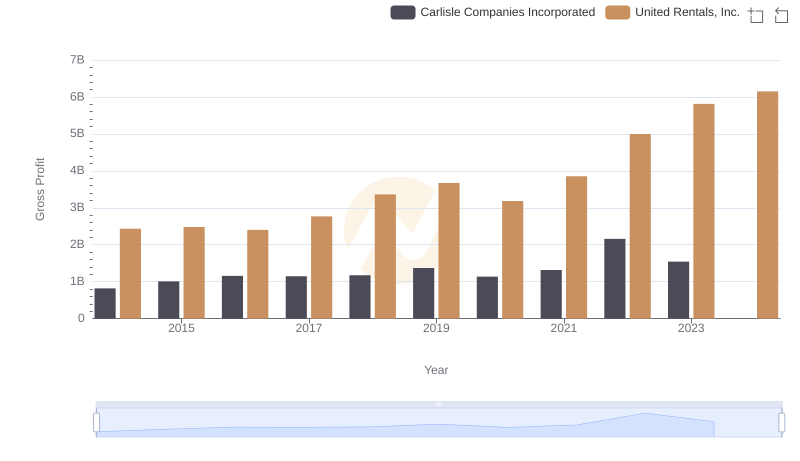
Gross Profit Comparison: United Rentals, Inc. and Carlisle Companies Incorporated Trends
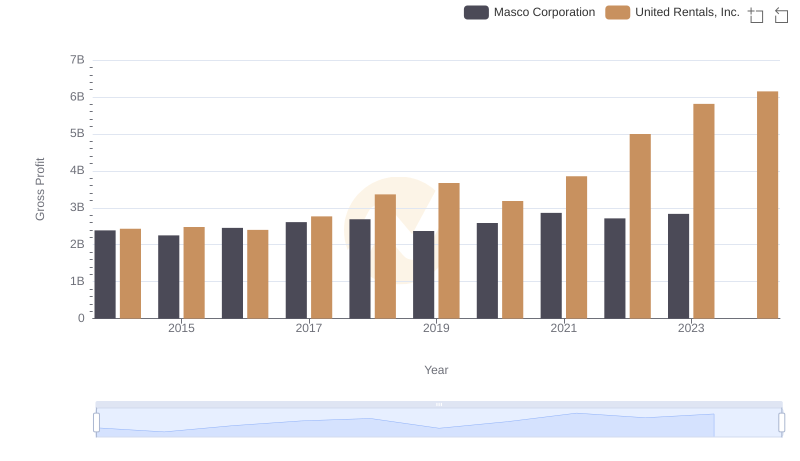
United Rentals, Inc. vs Masco Corporation: A Gross Profit Performance Breakdown
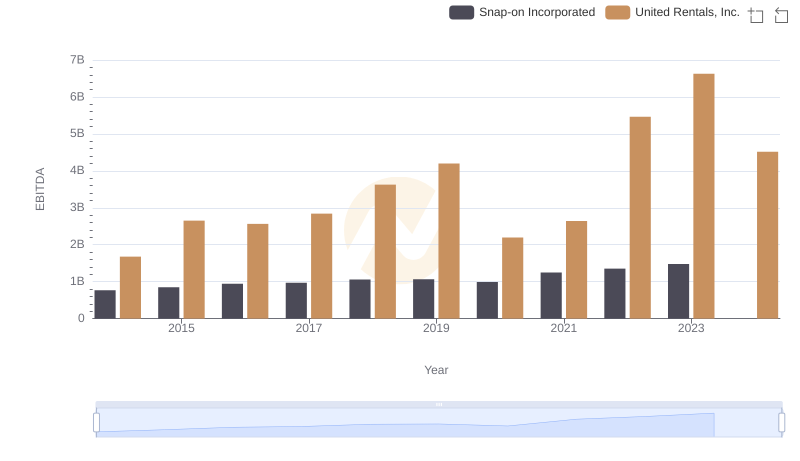
Comparative EBITDA Analysis: United Rentals, Inc. vs Snap-on Incorporated