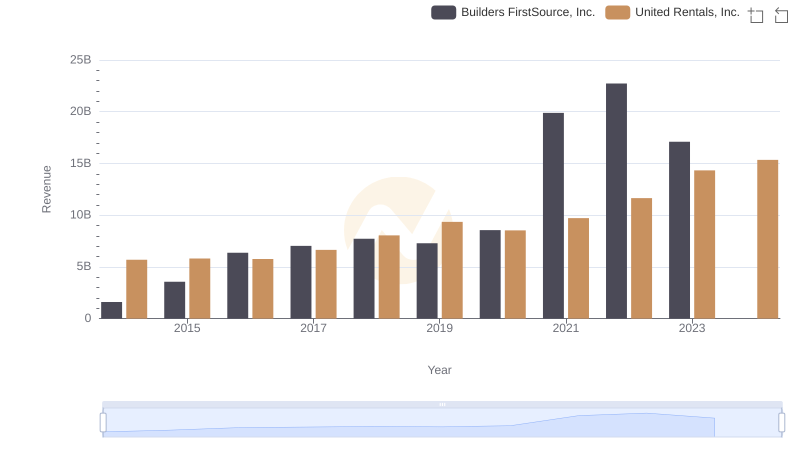
| __timestamp | Builders FirstSource, Inc. | United Rentals, Inc. |
|---|---|---|
| Wednesday, January 1, 2014 | 1247099000 | 3253000000 |
| Thursday, January 1, 2015 | 2662967000 | 3337000000 |
| Friday, January 1, 2016 | 4770536000 | 3359000000 |
| Sunday, January 1, 2017 | 5306818000 | 3872000000 |
| Monday, January 1, 2018 | 5801831000 | 4683000000 |
| Tuesday, January 1, 2019 | 5303602000 | 5681000000 |
| Wednesday, January 1, 2020 | 6336290000 | 5347000000 |
| Friday, January 1, 2021 | 14042900000 | 5863000000 |
| Saturday, January 1, 2022 | 14982039000 | 6646000000 |
| Sunday, January 1, 2023 | 11084996000 | 8519000000 |
| Monday, January 1, 2024 | 9195000000 |
Unleashing the power of data
In the ever-evolving landscape of the construction and rental industries, understanding cost structures is pivotal. Over the past decade, Builders FirstSource, Inc. and United Rentals, Inc. have showcased intriguing trends in their cost of revenue. From 2014 to 2023, Builders FirstSource experienced a staggering 790% increase, peaking in 2022. Meanwhile, United Rentals saw a steady rise, with a notable 162% growth, reaching its zenith in 2024.
The data reveals Builders FirstSource's aggressive expansion strategy, particularly evident in 2021 and 2022, where costs surged by over 120%. In contrast, United Rentals maintained a more consistent growth trajectory, reflecting its stable market position. However, 2024 data for Builders FirstSource remains elusive, hinting at potential shifts in strategy or market conditions. These insights offer a window into the strategic maneuvers of these industry titans, providing valuable lessons for stakeholders and investors alike.
United Rentals, Inc. or Builders FirstSource, Inc.: Who Leads in Yearly Revenue?
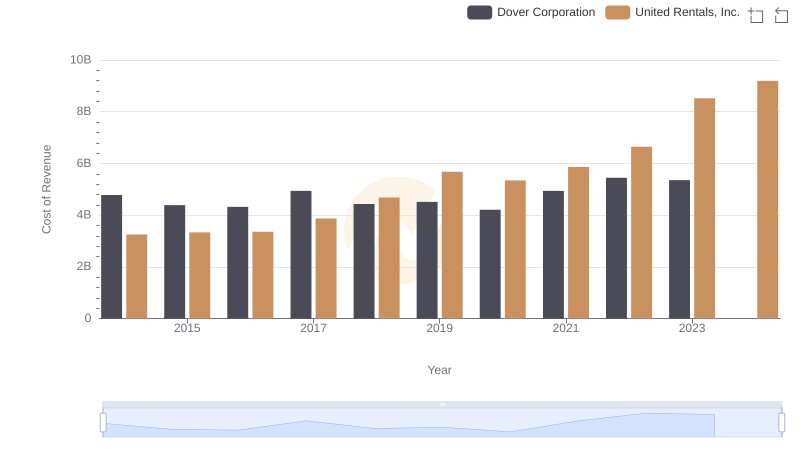
Cost Insights: Breaking Down United Rentals, Inc. and Dover Corporation's Expenses
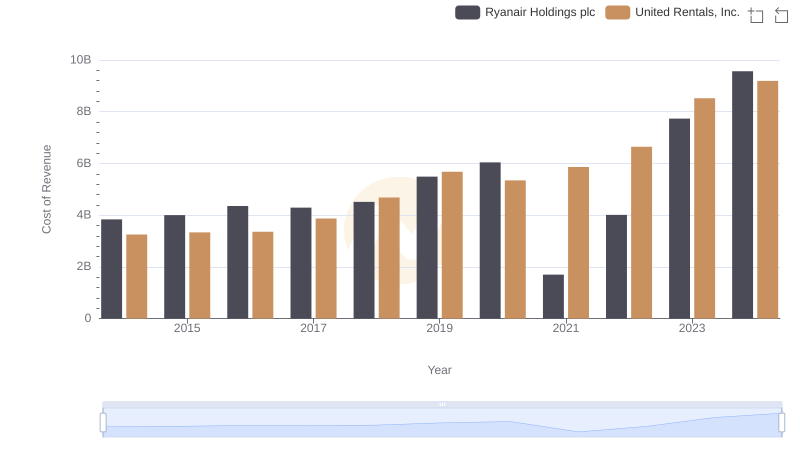
Cost Insights: Breaking Down United Rentals, Inc. and Ryanair Holdings plc's Expenses
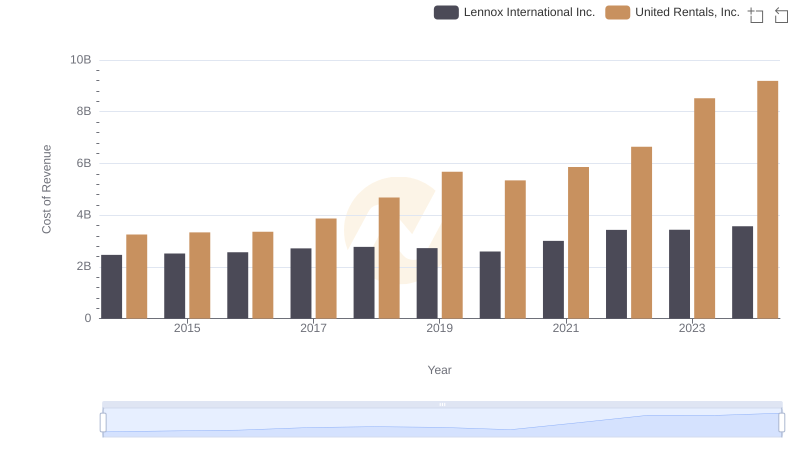
Cost of Revenue Trends: United Rentals, Inc. vs Lennox International Inc.
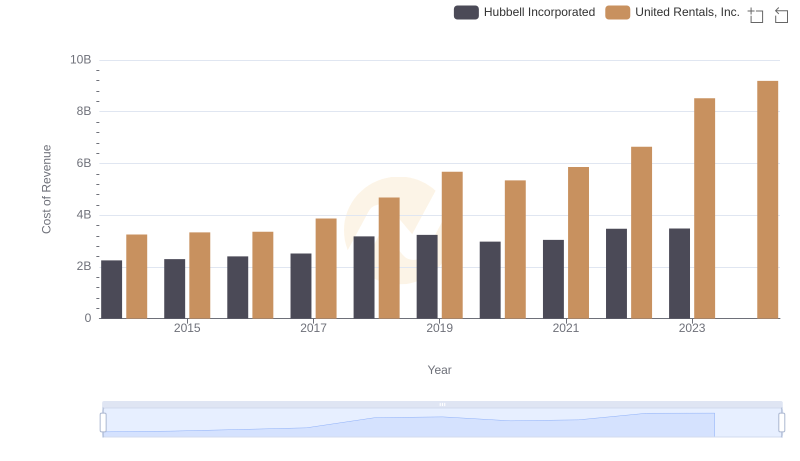
Comparing Cost of Revenue Efficiency: United Rentals, Inc. vs Hubbell Incorporated
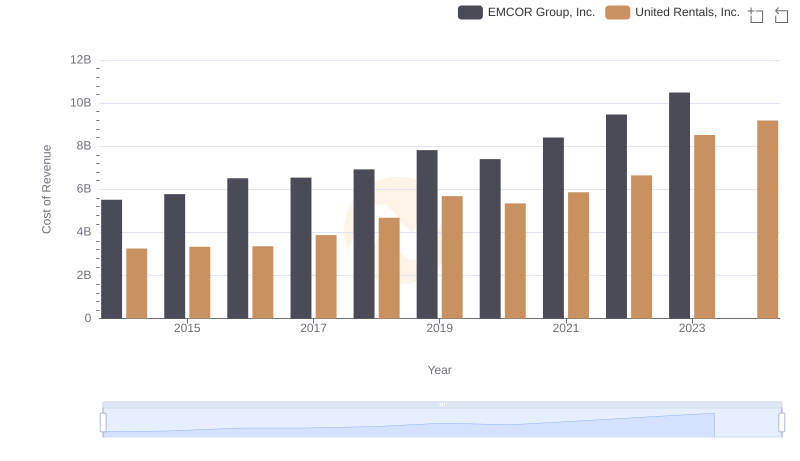
United Rentals, Inc. vs EMCOR Group, Inc.: Efficiency in Cost of Revenue Explored
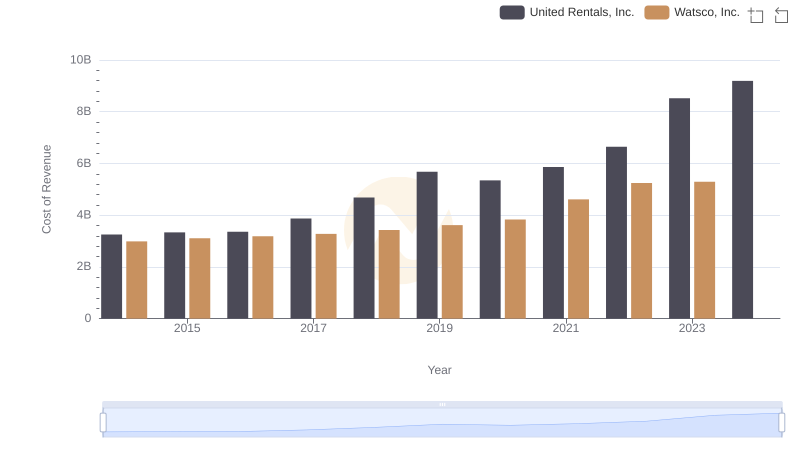
United Rentals, Inc. vs Watsco, Inc.: Efficiency in Cost of Revenue Explored
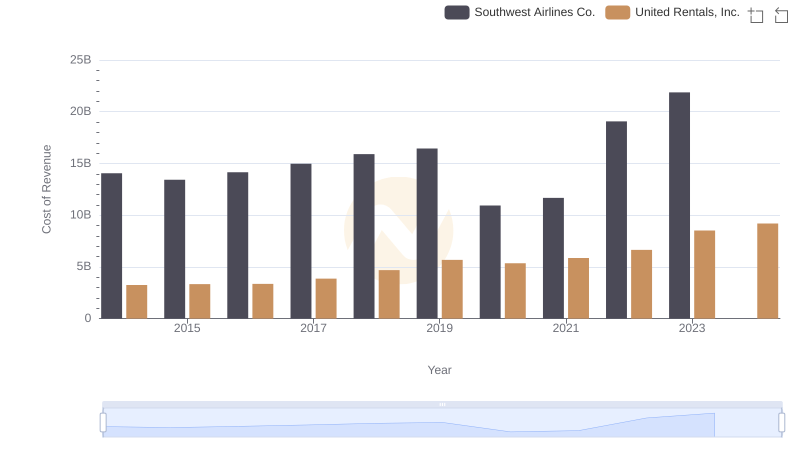
Cost Insights: Breaking Down United Rentals, Inc. and Southwest Airlines Co.'s Expenses
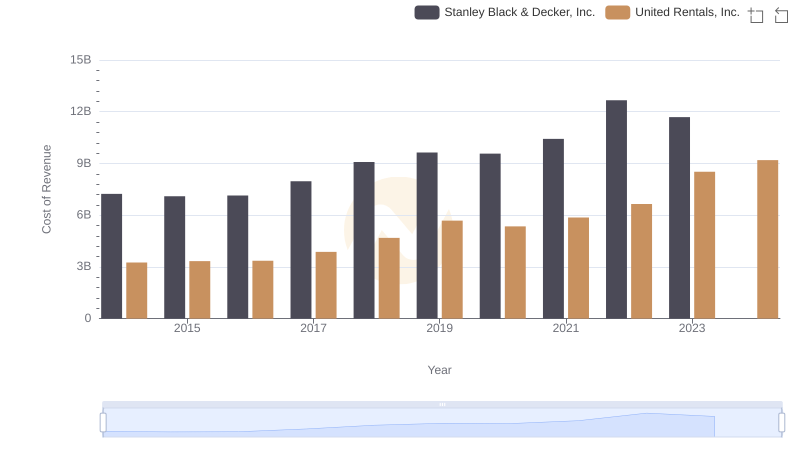
Cost of Revenue Comparison: United Rentals, Inc. vs Stanley Black & Decker, Inc.
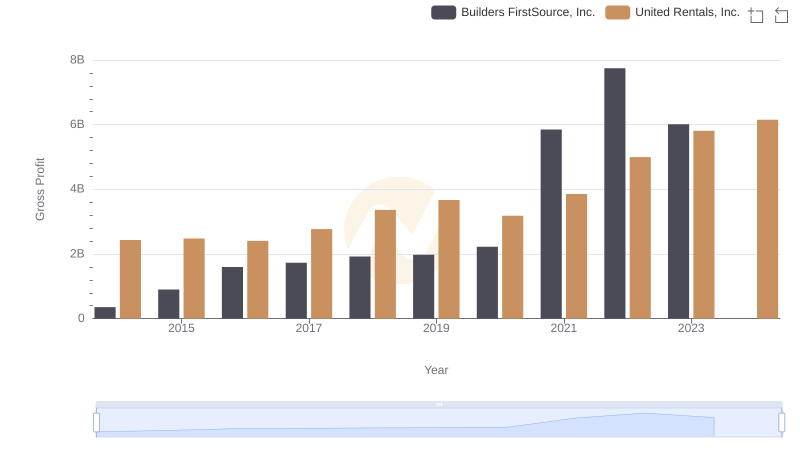
Gross Profit Comparison: United Rentals, Inc. and Builders FirstSource, Inc. Trends
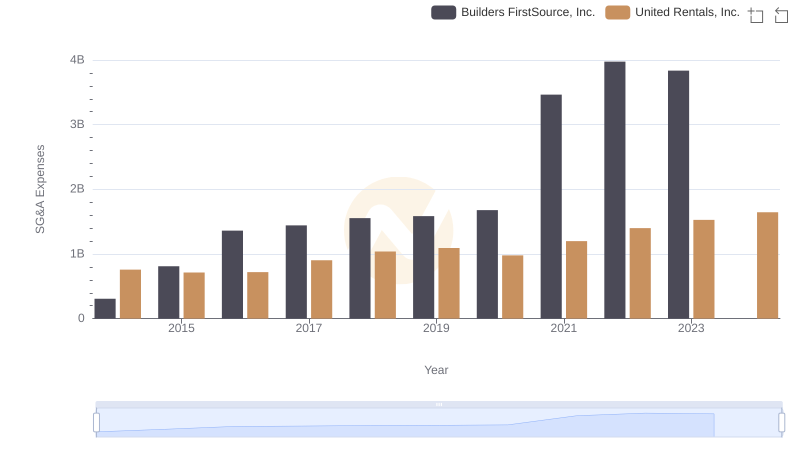
Who Optimizes SG&A Costs Better? United Rentals, Inc. or Builders FirstSource, Inc.
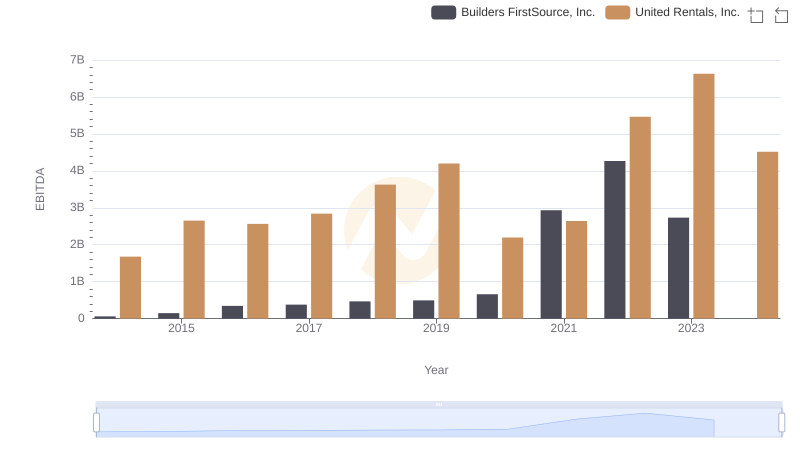
United Rentals, Inc. vs Builders FirstSource, Inc.: In-Depth EBITDA Performance Comparison