| __timestamp | Snap-on Incorporated | United Rentals, Inc. |
|---|---|---|
| Wednesday, January 1, 2014 | 767600000 | 1678000000 |
| Thursday, January 1, 2015 | 848900000 | 2653000000 |
| Friday, January 1, 2016 | 942400000 | 2566000000 |
| Sunday, January 1, 2017 | 971900000 | 2843000000 |
| Monday, January 1, 2018 | 1057400000 | 3628000000 |
| Tuesday, January 1, 2019 | 1067000000 | 4200000000 |
| Wednesday, January 1, 2020 | 991400000 | 2195000000 |
| Friday, January 1, 2021 | 1249100000 | 2642000000 |
| Saturday, January 1, 2022 | 1351500000 | 5464000000 |
| Sunday, January 1, 2023 | 1478800000 | 6627000000 |
| Monday, January 1, 2024 | 1520700000 | 4516000000 |
Infusing magic into the data realm
In the dynamic landscape of industrial services, United Rentals, Inc. and Snap-on Incorporated have showcased intriguing financial trajectories over the past decade. From 2014 to 2023, United Rentals has consistently outperformed Snap-on in terms of EBITDA, reflecting a robust growth strategy. Notably, United Rentals' EBITDA surged by approximately 295% from 2014 to 2023, peaking at $6.6 billion in 2023. In contrast, Snap-on's EBITDA grew by about 93% during the same period, reaching $1.5 billion in 2023.
The data for 2024 remains incomplete, suggesting potential shifts in the coming year.
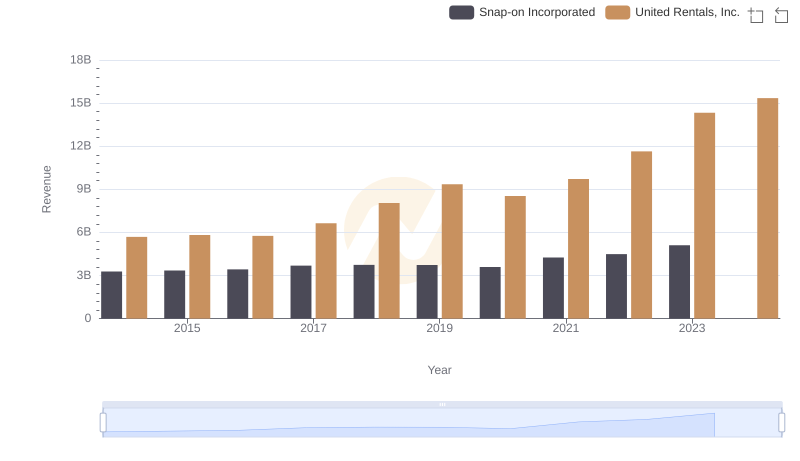
Breaking Down Revenue Trends: United Rentals, Inc. vs Snap-on Incorporated
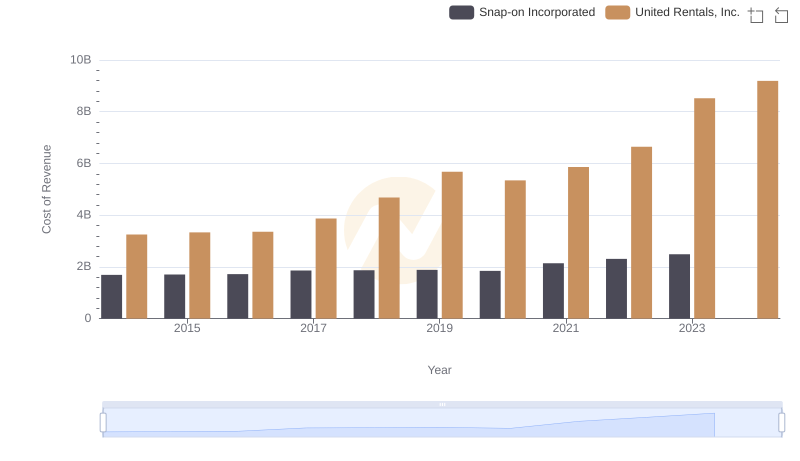
Cost Insights: Breaking Down United Rentals, Inc. and Snap-on Incorporated's Expenses
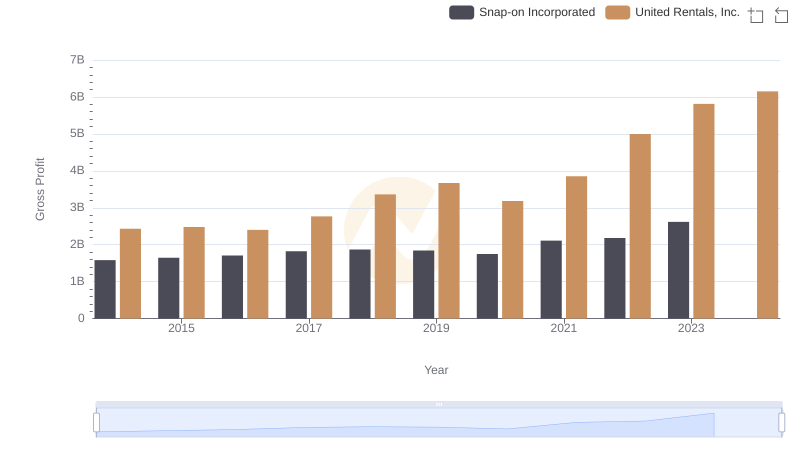
Gross Profit Analysis: Comparing United Rentals, Inc. and Snap-on Incorporated
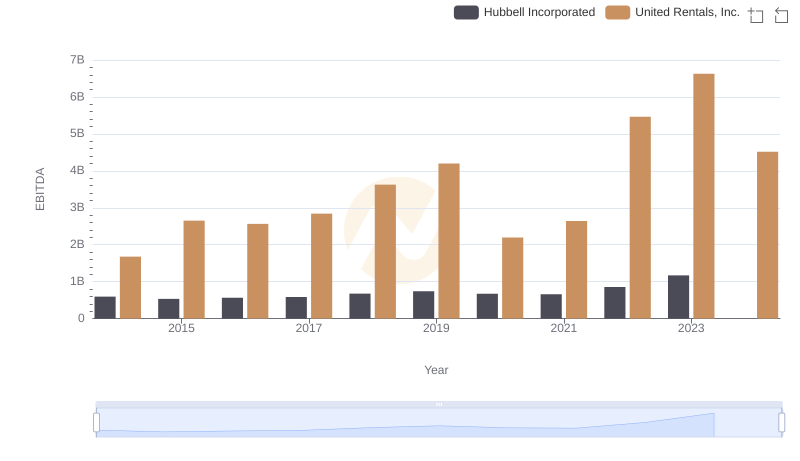
EBITDA Analysis: Evaluating United Rentals, Inc. Against Hubbell Incorporated

Comprehensive EBITDA Comparison: United Rentals, Inc. vs EMCOR Group, Inc.
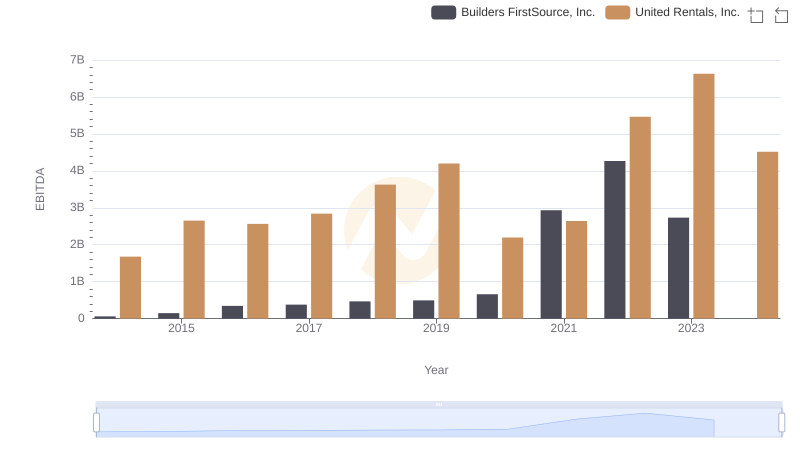
United Rentals, Inc. vs Builders FirstSource, Inc.: In-Depth EBITDA Performance Comparison
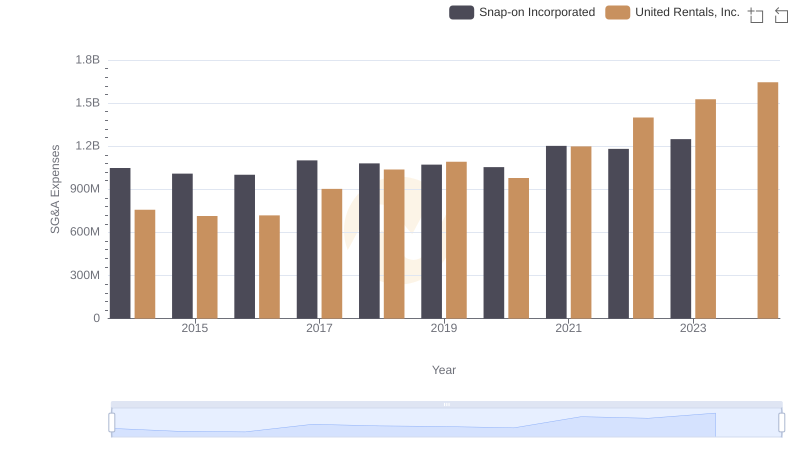
United Rentals, Inc. and Snap-on Incorporated: SG&A Spending Patterns Compared
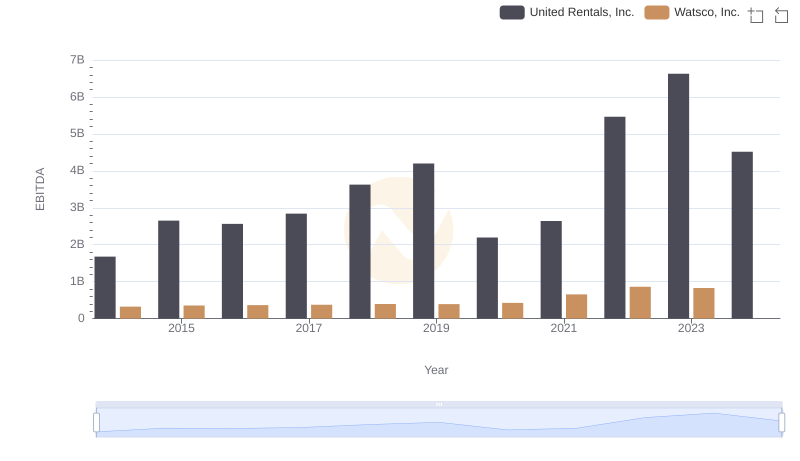
EBITDA Analysis: Evaluating United Rentals, Inc. Against Watsco, Inc.
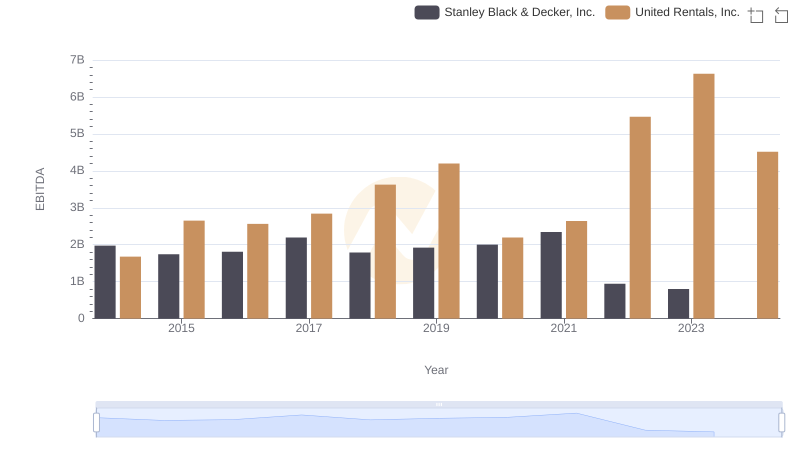
A Side-by-Side Analysis of EBITDA: United Rentals, Inc. and Stanley Black & Decker, Inc.
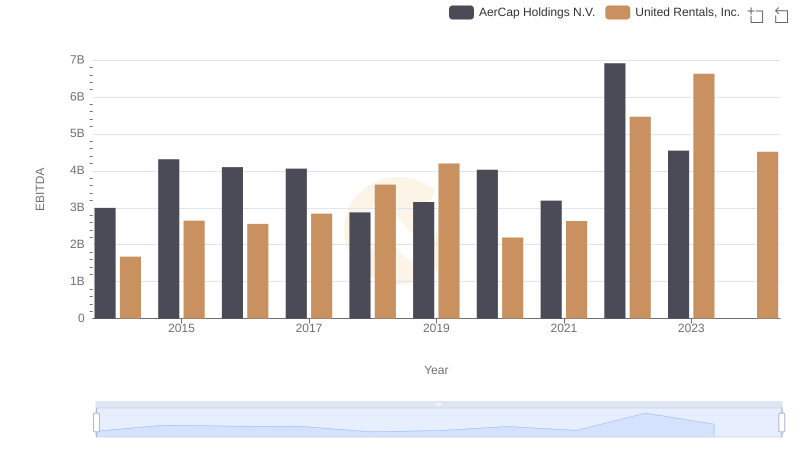
Comparative EBITDA Analysis: United Rentals, Inc. vs AerCap Holdings N.V.
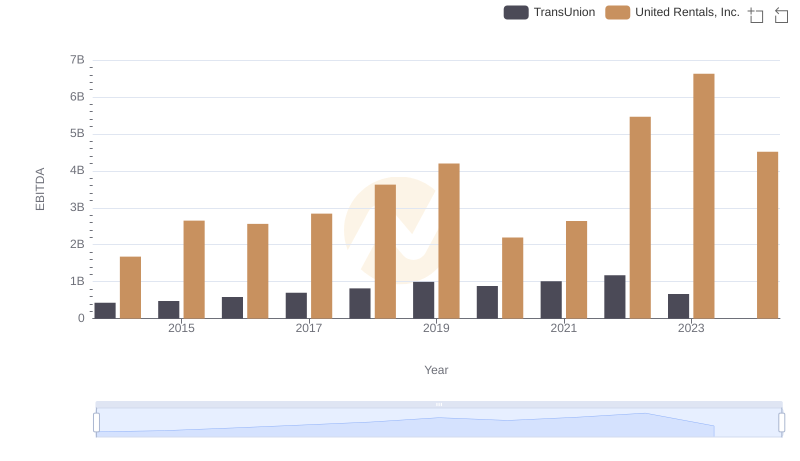
EBITDA Performance Review: United Rentals, Inc. vs TransUnion
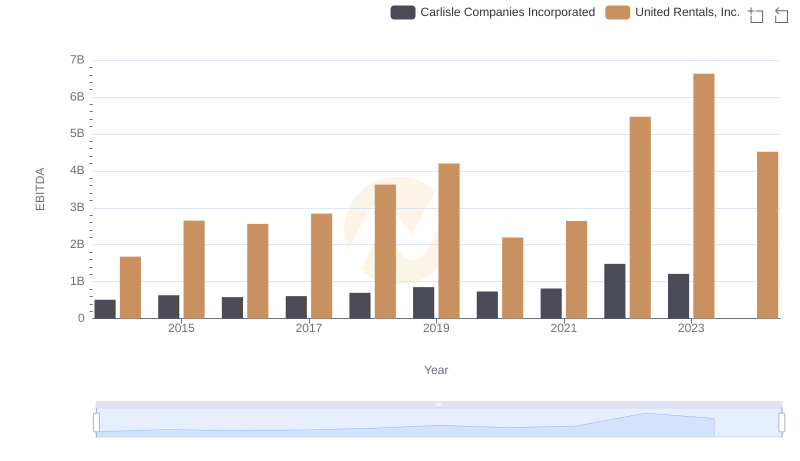
EBITDA Analysis: Evaluating United Rentals, Inc. Against Carlisle Companies Incorporated