| __timestamp | Snap-on Incorporated | United Rentals, Inc. |
|---|---|---|
| Wednesday, January 1, 2014 | 3277700000 | 5685000000 |
| Thursday, January 1, 2015 | 3352800000 | 5817000000 |
| Friday, January 1, 2016 | 3430400000 | 5762000000 |
| Sunday, January 1, 2017 | 3686900000 | 6641000000 |
| Monday, January 1, 2018 | 3740700000 | 8047000000 |
| Tuesday, January 1, 2019 | 3730000000 | 9351000000 |
| Wednesday, January 1, 2020 | 3592500000 | 8530000000 |
| Friday, January 1, 2021 | 4252000000 | 9716000000 |
| Saturday, January 1, 2022 | 4492800000 | 11642000000 |
| Sunday, January 1, 2023 | 5108300000 | 14332000000 |
| Monday, January 1, 2024 | 4707400000 | 15345000000 |
In pursuit of knowledge
In the competitive landscape of industrial equipment and tools, United Rentals, Inc. and Snap-on Incorporated have showcased intriguing revenue trajectories over the past decade. Since 2014, United Rentals has consistently outpaced Snap-on, with its revenue growing by approximately 170% by 2023. This growth is particularly notable in 2023, where United Rentals reported a revenue of $14.3 billion, marking a significant leap from $5.7 billion in 2014. In contrast, Snap-on's revenue has seen a steadier climb, increasing by about 56% over the same period, reaching $5.1 billion in 2023.
The data highlights a robust expansion for United Rentals, especially post-2017, where its revenue surged by over 70% in just six years. Meanwhile, Snap-on's growth, though more gradual, reflects a stable market presence. The absence of data for Snap-on in 2024 suggests a potential gap in reporting or market shifts, warranting further exploration.
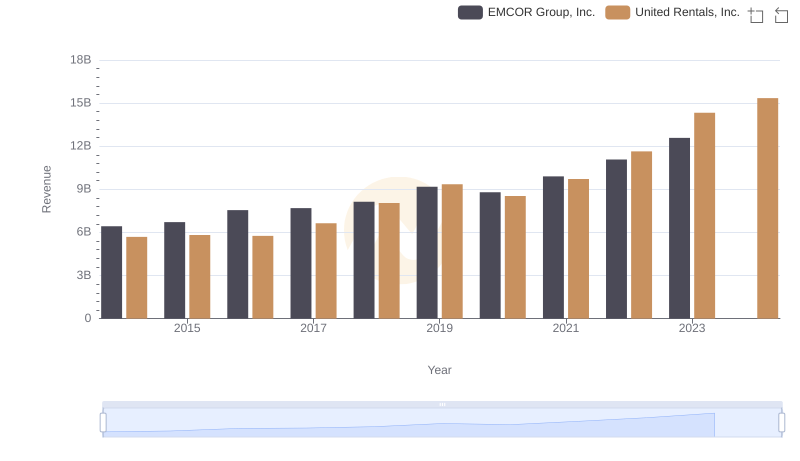
United Rentals, Inc. vs EMCOR Group, Inc.: Examining Key Revenue Metrics
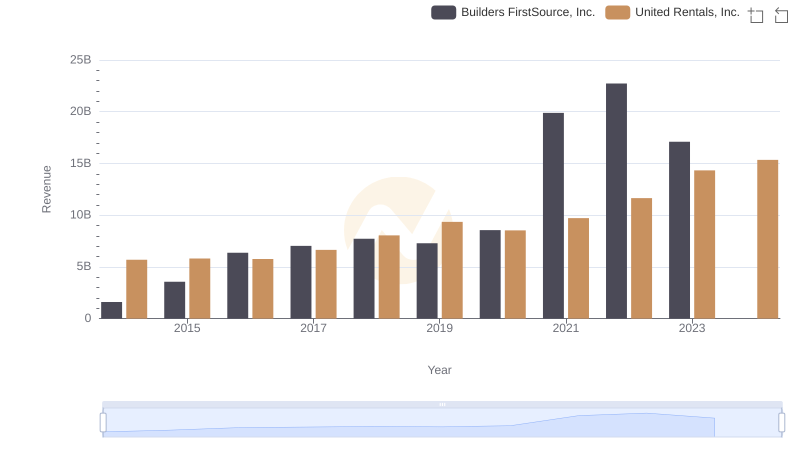
United Rentals, Inc. or Builders FirstSource, Inc.: Who Leads in Yearly Revenue?
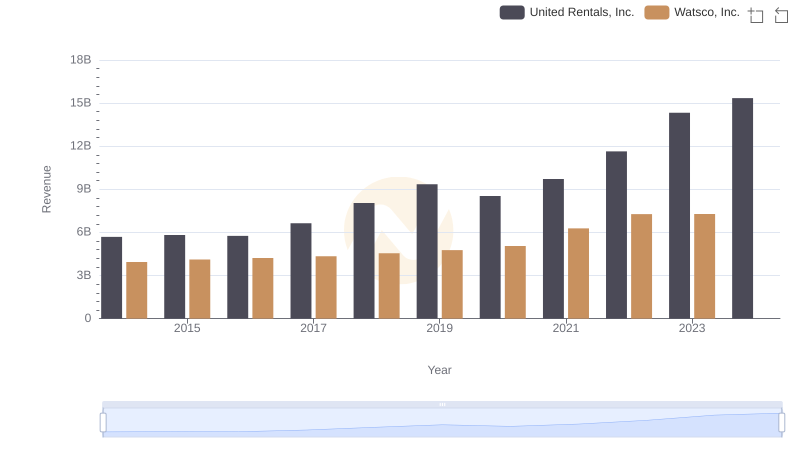
United Rentals, Inc. or Watsco, Inc.: Who Leads in Yearly Revenue?
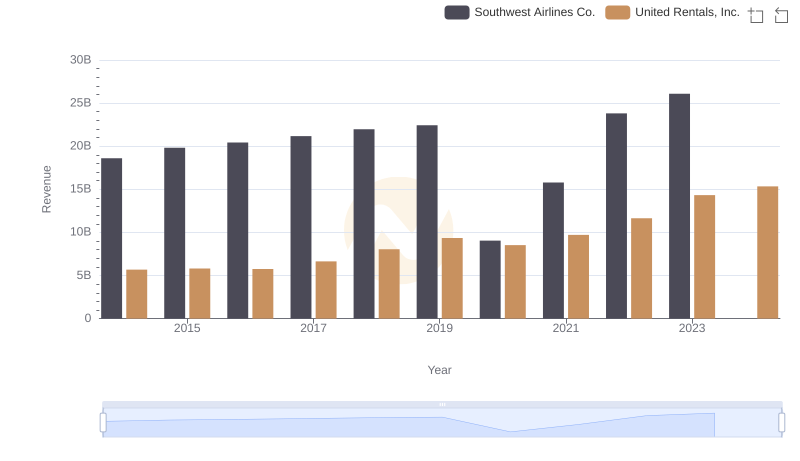
Comparing Revenue Performance: United Rentals, Inc. or Southwest Airlines Co.?
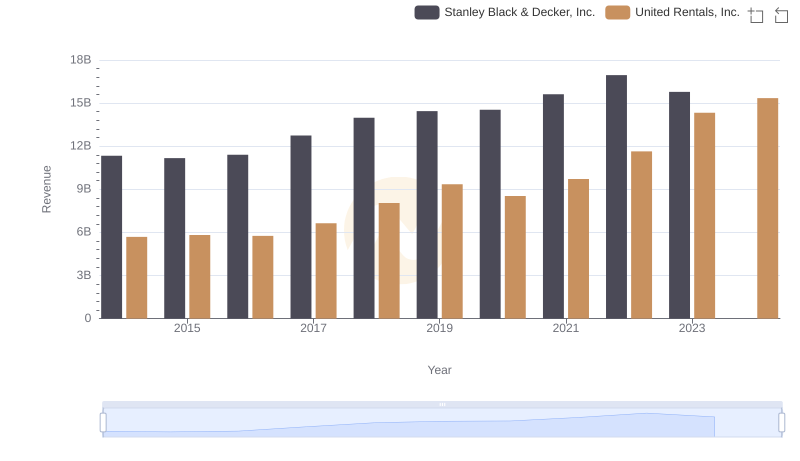
Comparing Revenue Performance: United Rentals, Inc. or Stanley Black & Decker, Inc.?
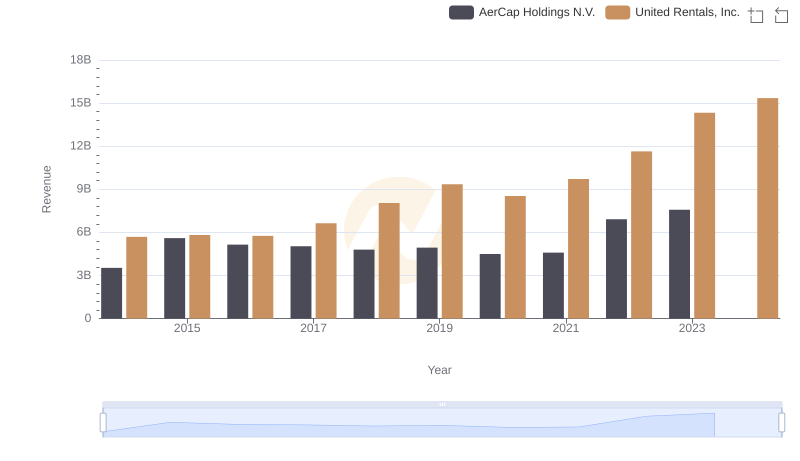
United Rentals, Inc. vs AerCap Holdings N.V.: Annual Revenue Growth Compared
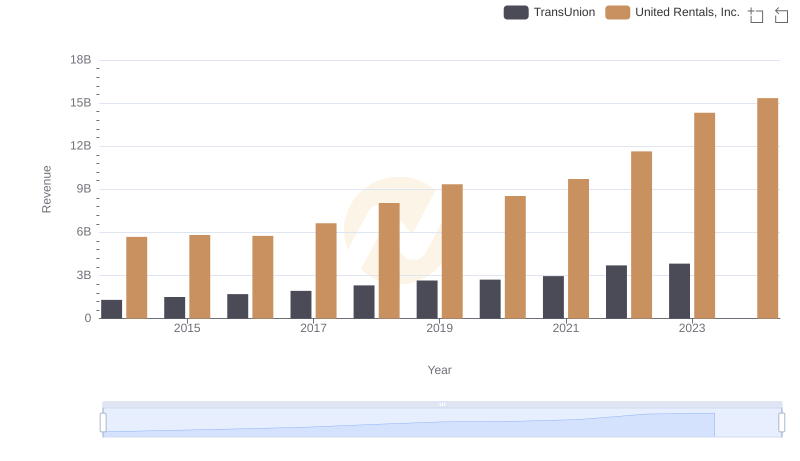
Comparing Revenue Performance: United Rentals, Inc. or TransUnion?
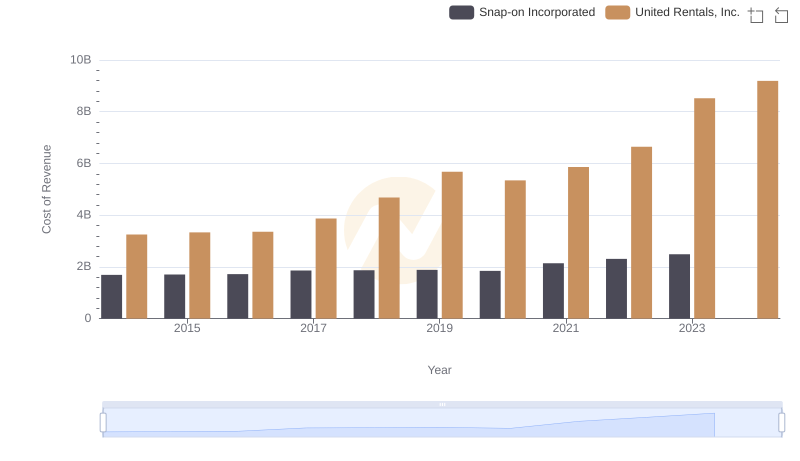
Cost Insights: Breaking Down United Rentals, Inc. and Snap-on Incorporated's Expenses
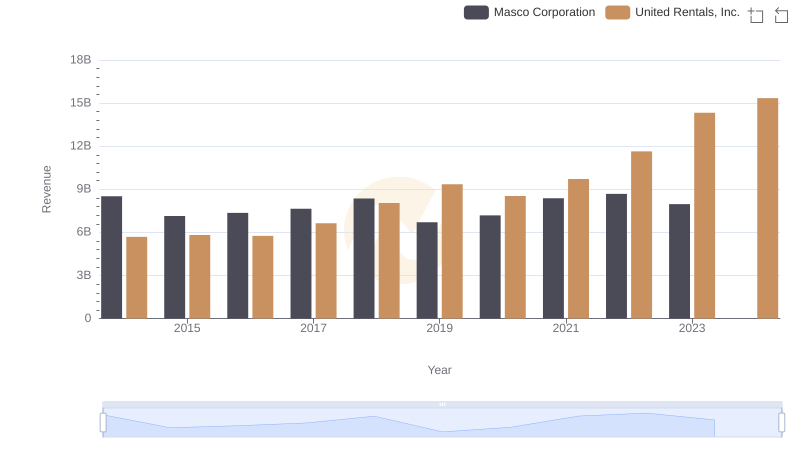
United Rentals, Inc. or Masco Corporation: Who Leads in Yearly Revenue?
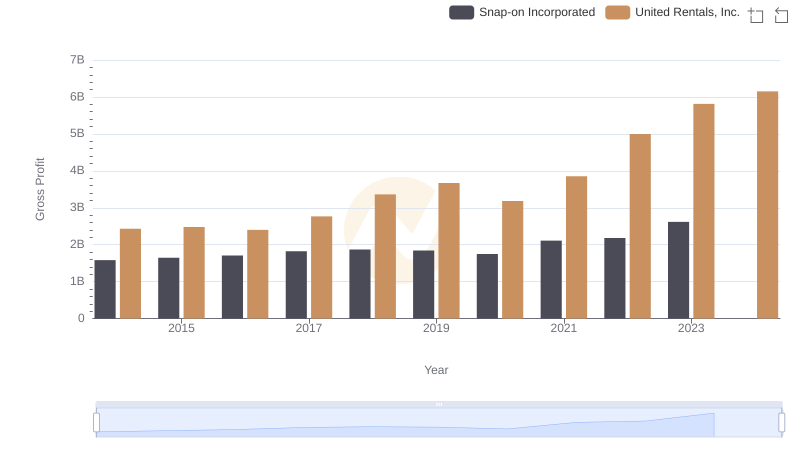
Gross Profit Analysis: Comparing United Rentals, Inc. and Snap-on Incorporated
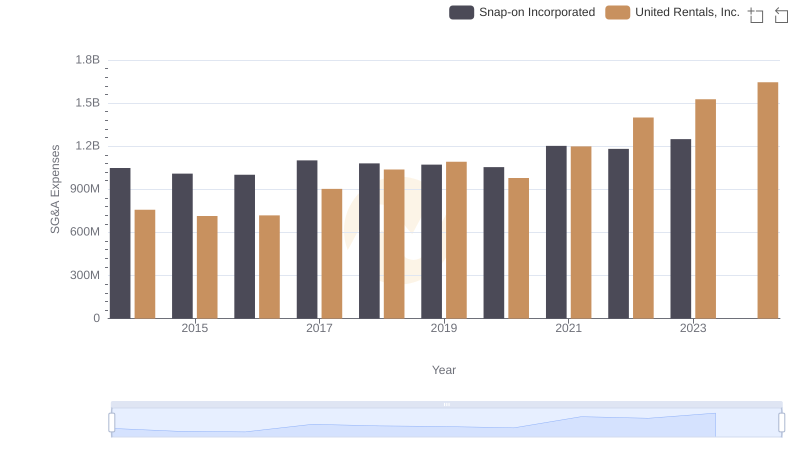
United Rentals, Inc. and Snap-on Incorporated: SG&A Spending Patterns Compared
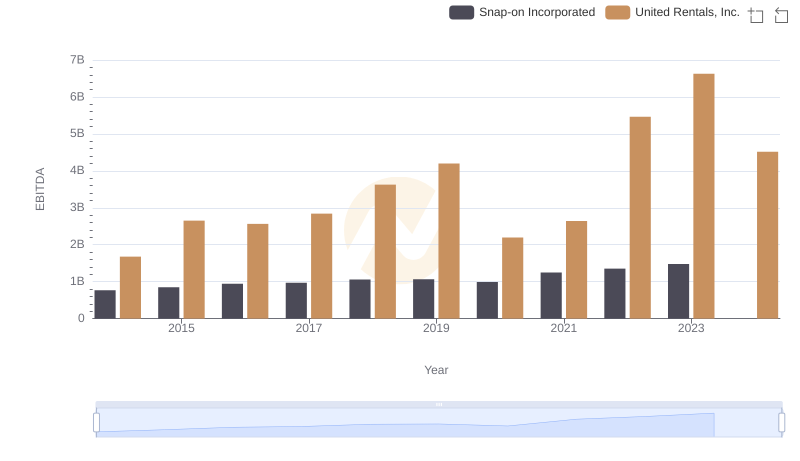
Comparative EBITDA Analysis: United Rentals, Inc. vs Snap-on Incorporated