| __timestamp | EMCOR Group, Inc. | United Rentals, Inc. |
|---|---|---|
| Wednesday, January 1, 2014 | 5517719000 | 3253000000 |
| Thursday, January 1, 2015 | 5774247000 | 3337000000 |
| Friday, January 1, 2016 | 6513662000 | 3359000000 |
| Sunday, January 1, 2017 | 6539987000 | 3872000000 |
| Monday, January 1, 2018 | 6925178000 | 4683000000 |
| Tuesday, January 1, 2019 | 7818743000 | 5681000000 |
| Wednesday, January 1, 2020 | 7401679000 | 5347000000 |
| Friday, January 1, 2021 | 8401843000 | 5863000000 |
| Saturday, January 1, 2022 | 9472526000 | 6646000000 |
| Sunday, January 1, 2023 | 10493534000 | 8519000000 |
| Monday, January 1, 2024 | 9195000000 |
Unveiling the hidden dimensions of data
In the competitive landscape of the construction and engineering sectors, cost efficiency is paramount. Over the past decade, United Rentals, Inc. and EMCOR Group, Inc. have demonstrated distinct trajectories in managing their cost of revenue. From 2014 to 2023, EMCOR Group, Inc. consistently maintained a higher cost of revenue, peaking at approximately $10.5 billion in 2023, reflecting a 90% increase from 2014. In contrast, United Rentals, Inc. showcased a more dynamic growth, with its cost of revenue surging by nearly 160% over the same period, reaching around $8.5 billion in 2023. This data highlights United Rentals' aggressive expansion strategy, while EMCOR's steady growth underscores its robust market position. Notably, 2024 data for EMCOR is missing, suggesting potential shifts in their financial strategy. These insights offer a compelling narrative of how these industry giants navigate financial efficiency.
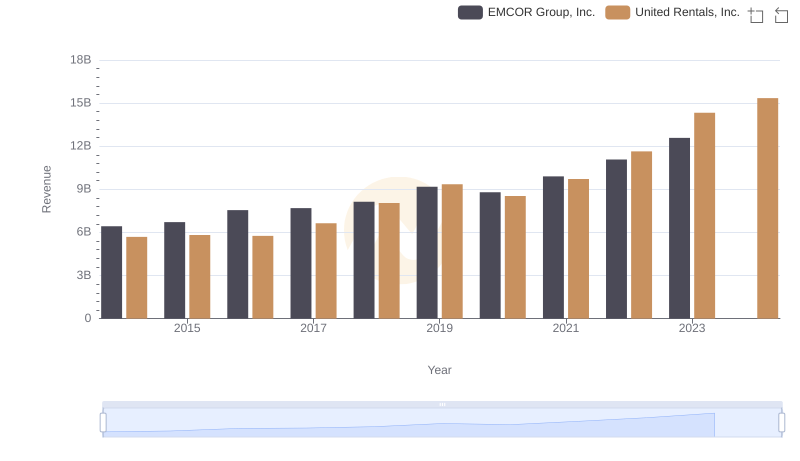
United Rentals, Inc. vs EMCOR Group, Inc.: Examining Key Revenue Metrics
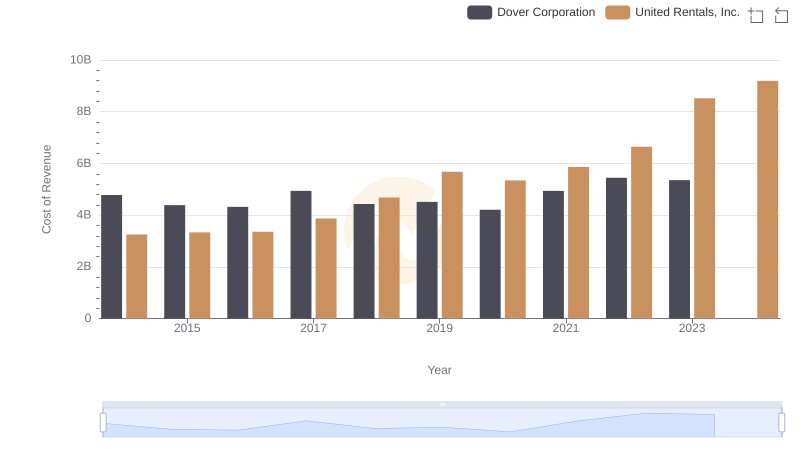
Cost Insights: Breaking Down United Rentals, Inc. and Dover Corporation's Expenses
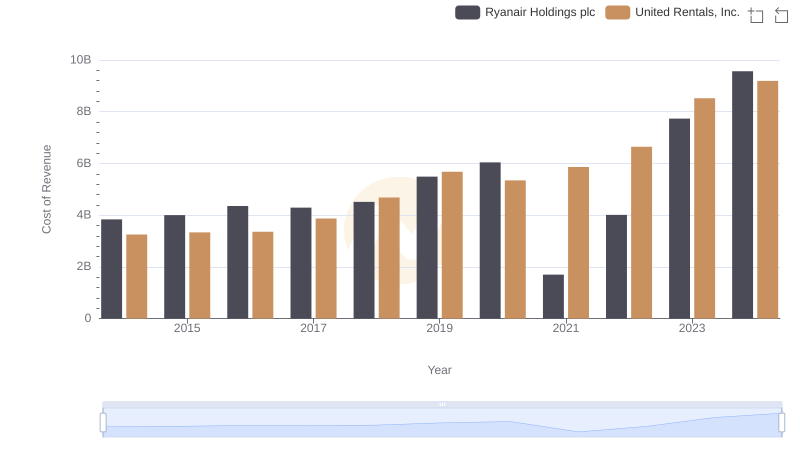
Cost Insights: Breaking Down United Rentals, Inc. and Ryanair Holdings plc's Expenses
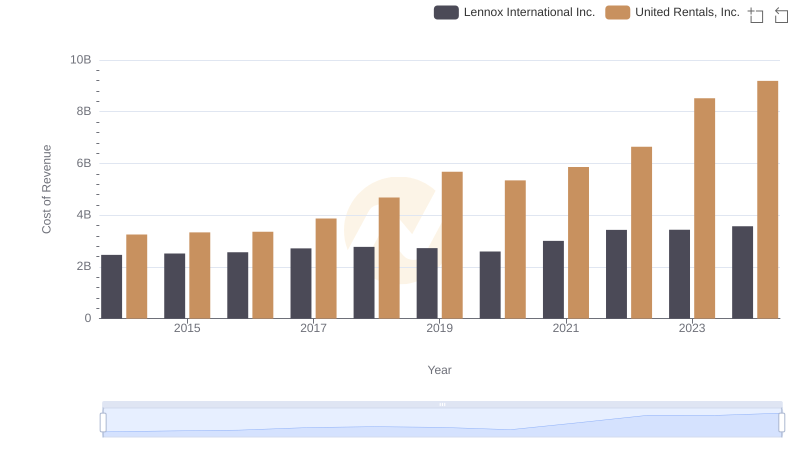
Cost of Revenue Trends: United Rentals, Inc. vs Lennox International Inc.
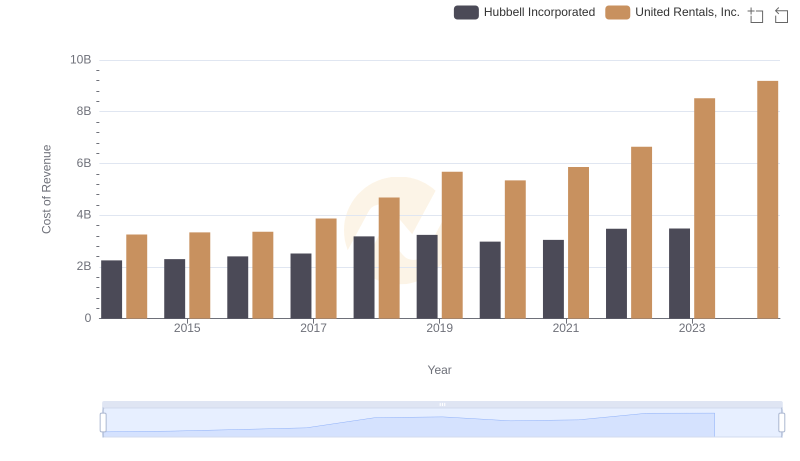
Comparing Cost of Revenue Efficiency: United Rentals, Inc. vs Hubbell Incorporated
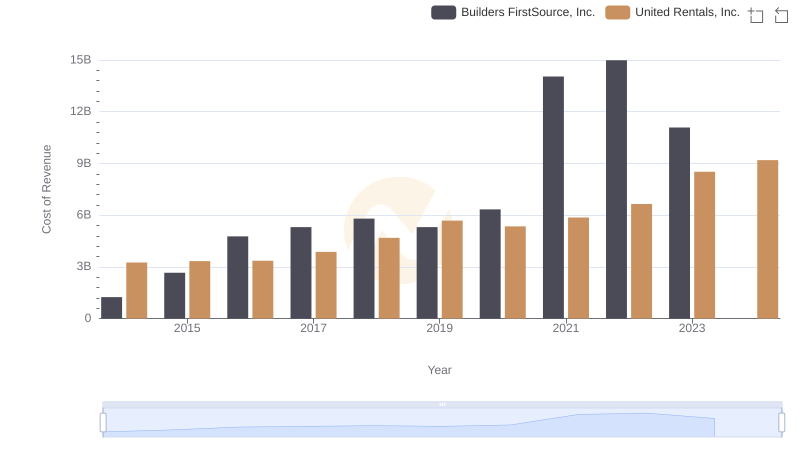
Cost Insights: Breaking Down United Rentals, Inc. and Builders FirstSource, Inc.'s Expenses
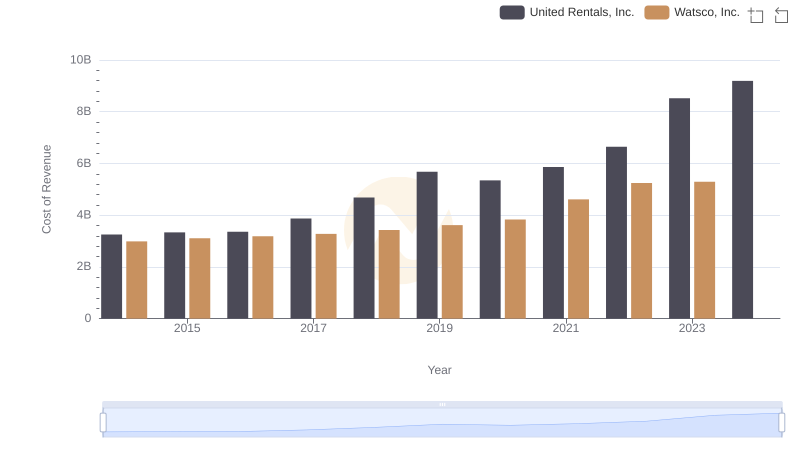
United Rentals, Inc. vs Watsco, Inc.: Efficiency in Cost of Revenue Explored
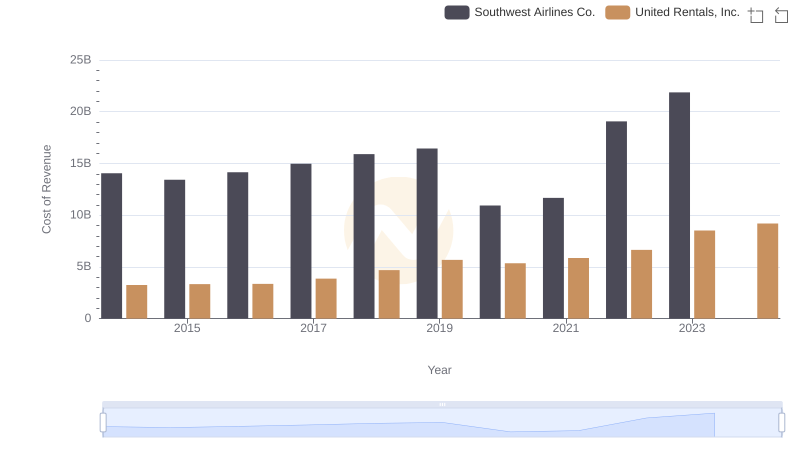
Cost Insights: Breaking Down United Rentals, Inc. and Southwest Airlines Co.'s Expenses
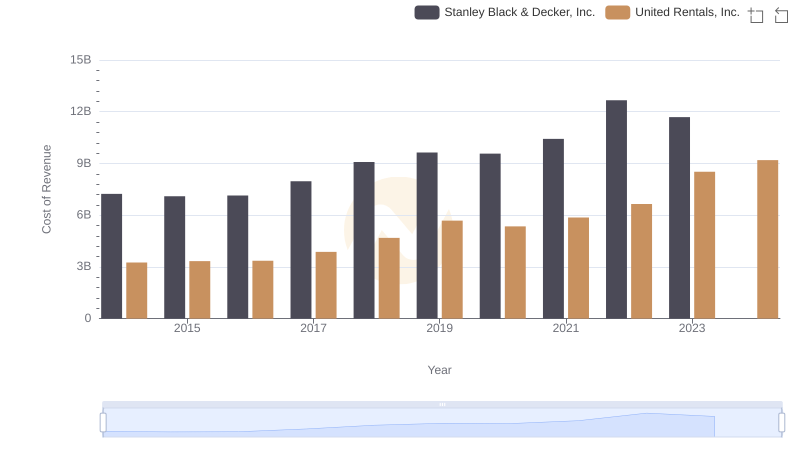
Cost of Revenue Comparison: United Rentals, Inc. vs Stanley Black & Decker, Inc.
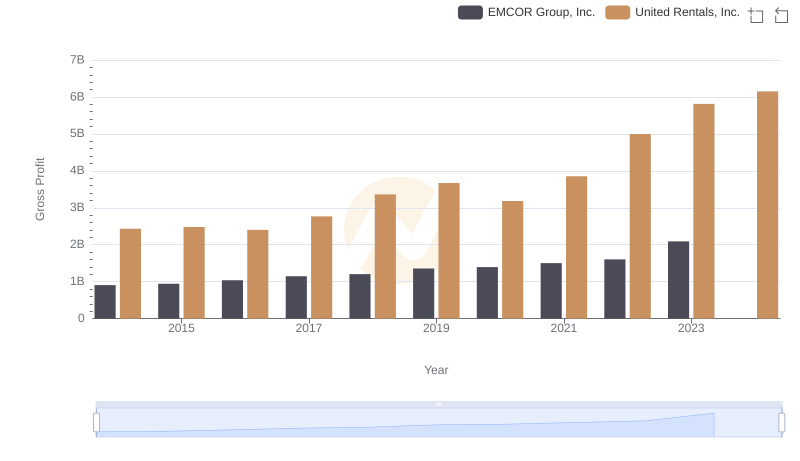
United Rentals, Inc. and EMCOR Group, Inc.: A Detailed Gross Profit Analysis
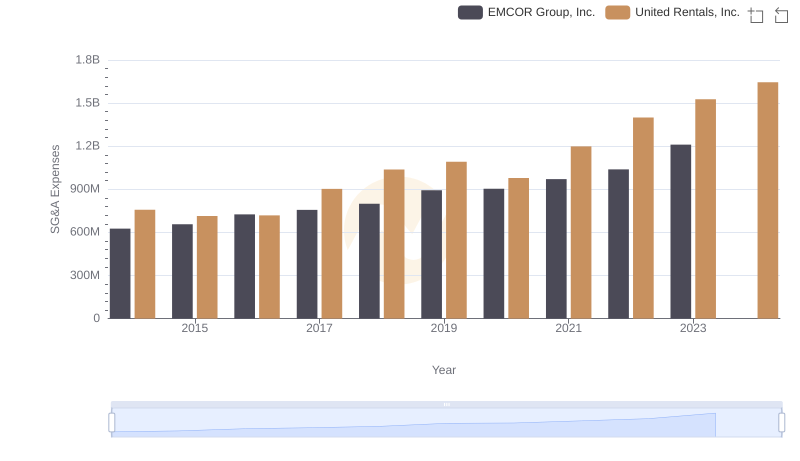
SG&A Efficiency Analysis: Comparing United Rentals, Inc. and EMCOR Group, Inc.

Comprehensive EBITDA Comparison: United Rentals, Inc. vs EMCOR Group, Inc.