| __timestamp | TransUnion | United Rentals, Inc. |
|---|---|---|
| Wednesday, January 1, 2014 | 499100000 | 3253000000 |
| Thursday, January 1, 2015 | 531600000 | 3337000000 |
| Friday, January 1, 2016 | 579100000 | 3359000000 |
| Sunday, January 1, 2017 | 645700000 | 3872000000 |
| Monday, January 1, 2018 | 790100000 | 4683000000 |
| Tuesday, January 1, 2019 | 874100000 | 5681000000 |
| Wednesday, January 1, 2020 | 920400000 | 5347000000 |
| Friday, January 1, 2021 | 991600000 | 5863000000 |
| Saturday, January 1, 2022 | 1222900000 | 6646000000 |
| Sunday, January 1, 2023 | 1517300000 | 8519000000 |
| Monday, January 1, 2024 | 0 | 9195000000 |
Unlocking the unknown
In the ever-evolving landscape of corporate finance, understanding cost structures is crucial. From 2014 to 2023, United Rentals, Inc. and TransUnion have shown distinct trajectories in their cost of revenue. United Rentals, Inc. has seen a robust growth, with costs rising by approximately 182% over the decade, peaking at an impressive $8.5 billion in 2023. This reflects their aggressive expansion and operational scaling. In contrast, TransUnion's cost of revenue increased by about 204%, reaching $1.5 billion in 2023, indicating a steady yet significant growth in their data-driven services. Notably, 2024 data for TransUnion is missing, suggesting a potential gap in reporting or a strategic shift. These insights highlight the dynamic nature of cost management in different sectors, offering a window into the strategic priorities of these industry leaders.
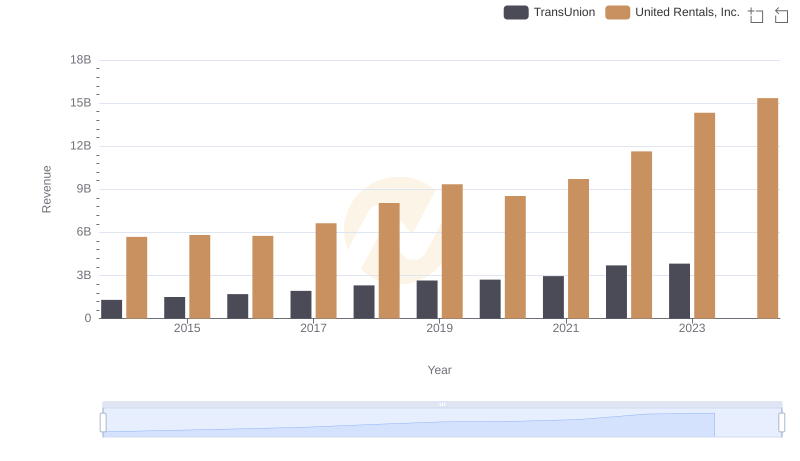
Comparing Revenue Performance: United Rentals, Inc. or TransUnion?
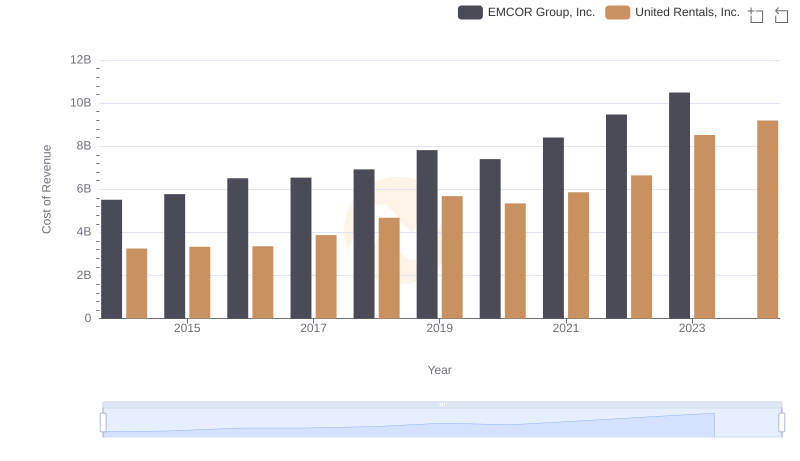
United Rentals, Inc. vs EMCOR Group, Inc.: Efficiency in Cost of Revenue Explored
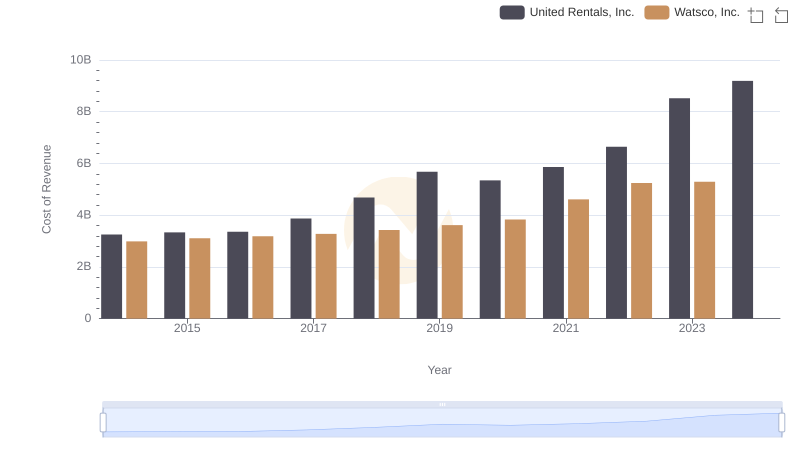
United Rentals, Inc. vs Watsco, Inc.: Efficiency in Cost of Revenue Explored
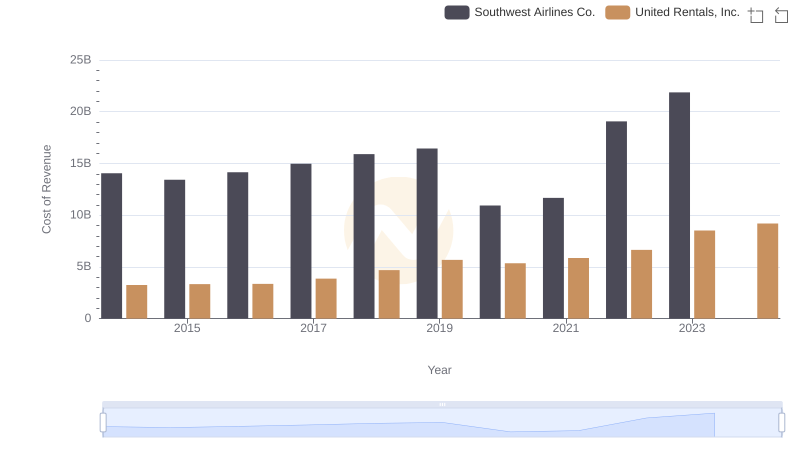
Cost Insights: Breaking Down United Rentals, Inc. and Southwest Airlines Co.'s Expenses
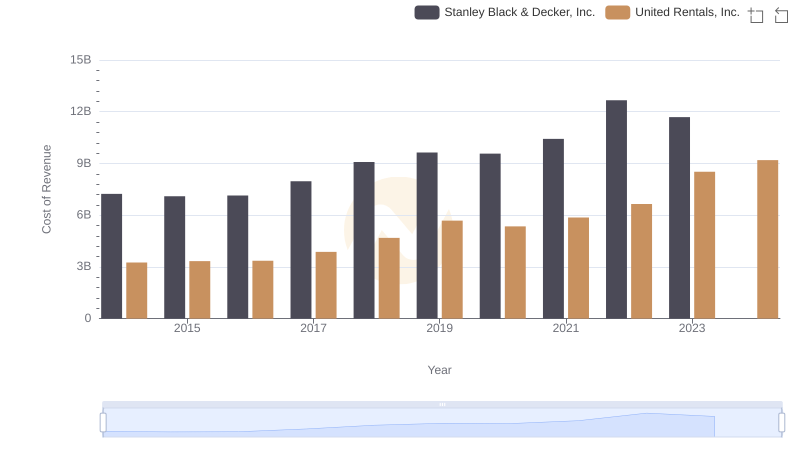
Cost of Revenue Comparison: United Rentals, Inc. vs Stanley Black & Decker, Inc.
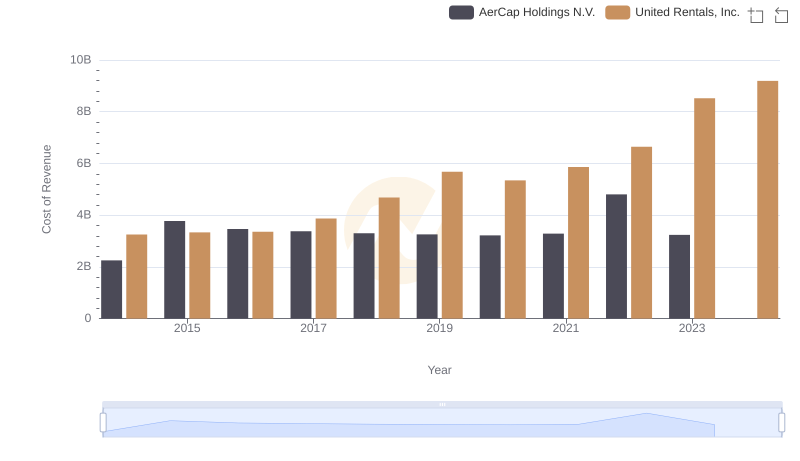
Cost Insights: Breaking Down United Rentals, Inc. and AerCap Holdings N.V.'s Expenses
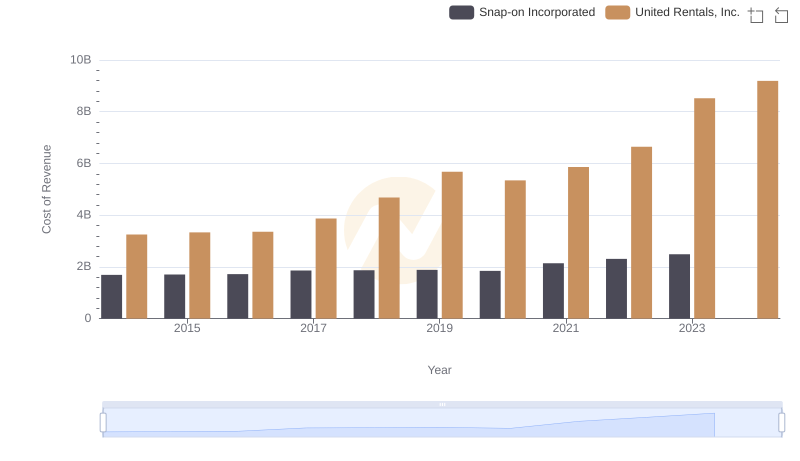
Cost Insights: Breaking Down United Rentals, Inc. and Snap-on Incorporated's Expenses
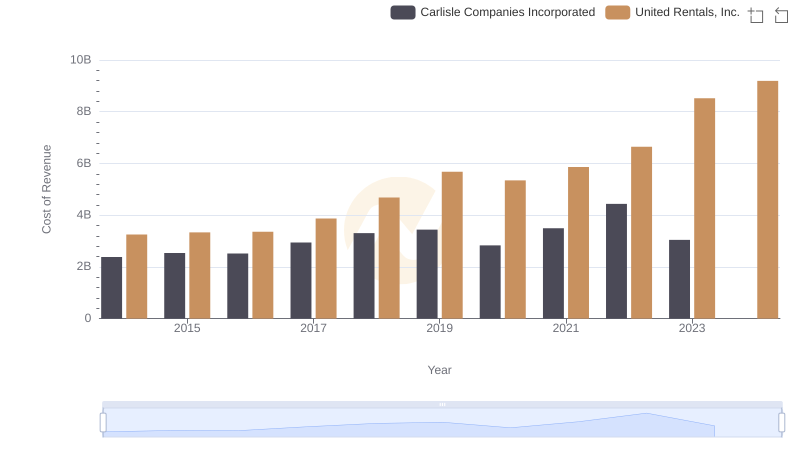
Analyzing Cost of Revenue: United Rentals, Inc. and Carlisle Companies Incorporated
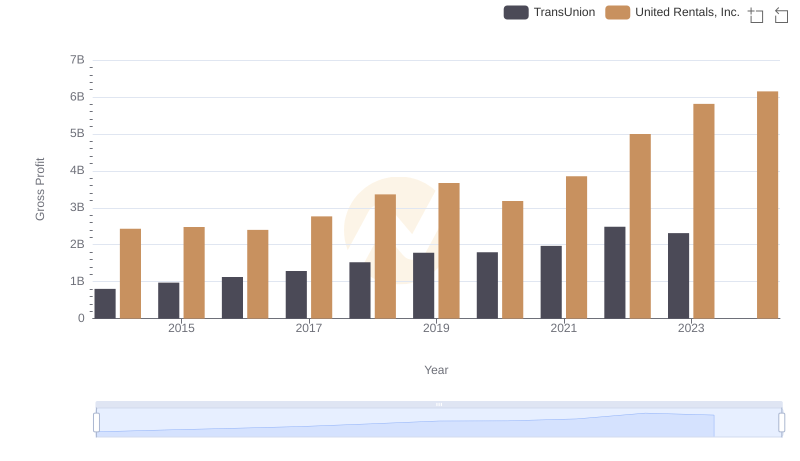
United Rentals, Inc. and TransUnion: A Detailed Gross Profit Analysis
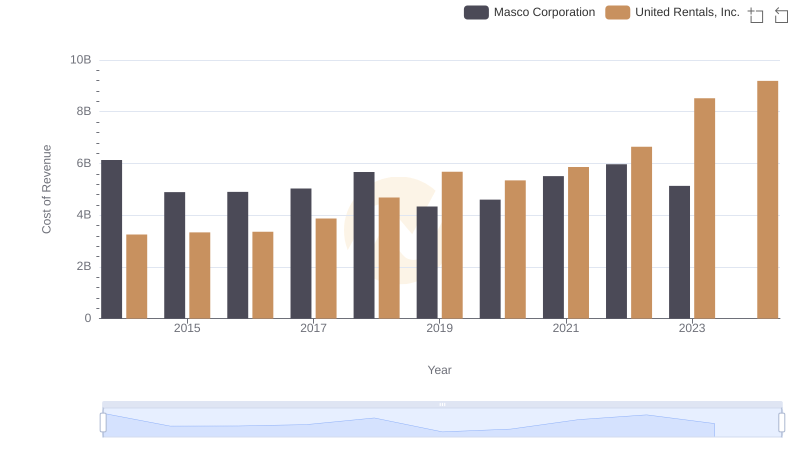
Comparing Cost of Revenue Efficiency: United Rentals, Inc. vs Masco Corporation
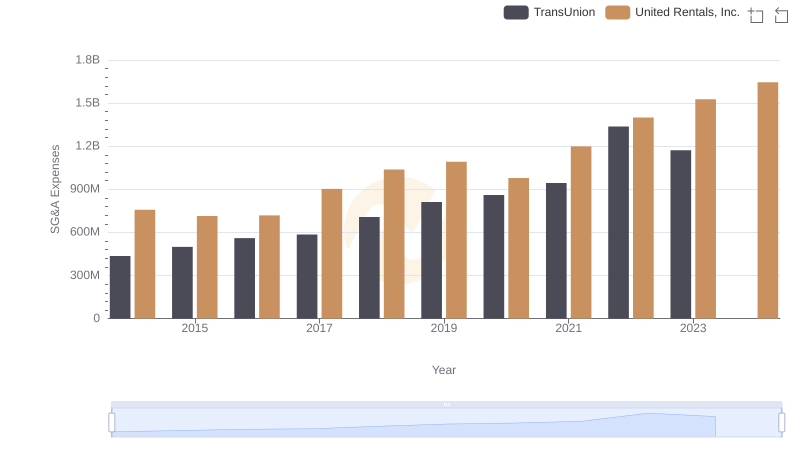
Breaking Down SG&A Expenses: United Rentals, Inc. vs TransUnion
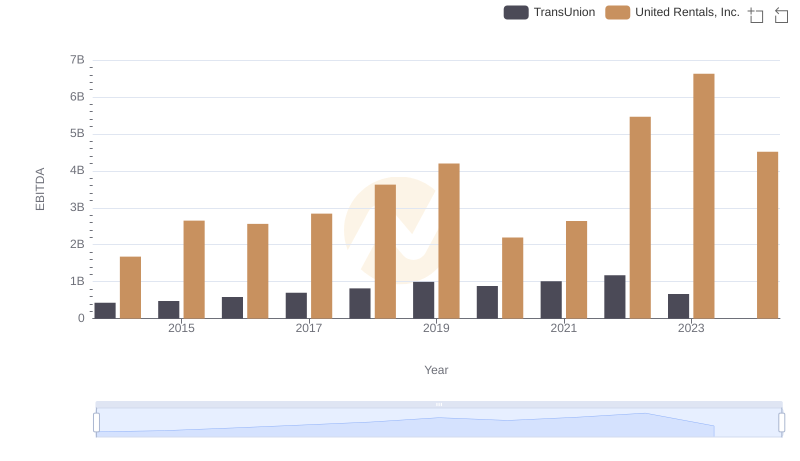
EBITDA Performance Review: United Rentals, Inc. vs TransUnion