| __timestamp | CGI Inc. | International Business Machines Corporation |
|---|---|---|
| Wednesday, January 1, 2014 | 1813301000 | 24962000000 |
| Thursday, January 1, 2015 | 1845401000 | 20268000000 |
| Friday, January 1, 2016 | 1929339000 | 17341000000 |
| Sunday, January 1, 2017 | 1962419000 | 16556000000 |
| Monday, January 1, 2018 | 2092453000 | 16545000000 |
| Tuesday, January 1, 2019 | 2136374000 | 14609000000 |
| Wednesday, January 1, 2020 | 2192519000 | 10555000000 |
| Friday, January 1, 2021 | 2451697000 | 12409000000 |
| Saturday, January 1, 2022 | 2528385000 | 7174000000 |
| Sunday, January 1, 2023 | 2736123000 | 14693000000 |
| Monday, January 1, 2024 | 2822924000 | 6015000000 |
Data in motion
In the ever-evolving tech landscape, the financial health of companies like International Business Machines Corporation (IBM) and CGI Inc. is pivotal. Over the past decade, from 2014 to 2023, IBM's EBITDA has seen a significant decline, dropping from a peak of $24.6 billion in 2014 to a low of $6.9 billion in 2022, before rebounding to $14.6 billion in 2023. This represents a staggering 72% drop at its lowest point. In contrast, CGI Inc. has shown a steady upward trajectory, with its EBITDA growing by approximately 56% from $1.8 billion in 2014 to $2.8 billion in 2023. This growth highlights CGI's resilience and strategic positioning in the market. The data for 2024 is incomplete, leaving room for speculation on future trends. As the tech industry continues to transform, these financial insights offer a glimpse into the strategic maneuvers of these giants.
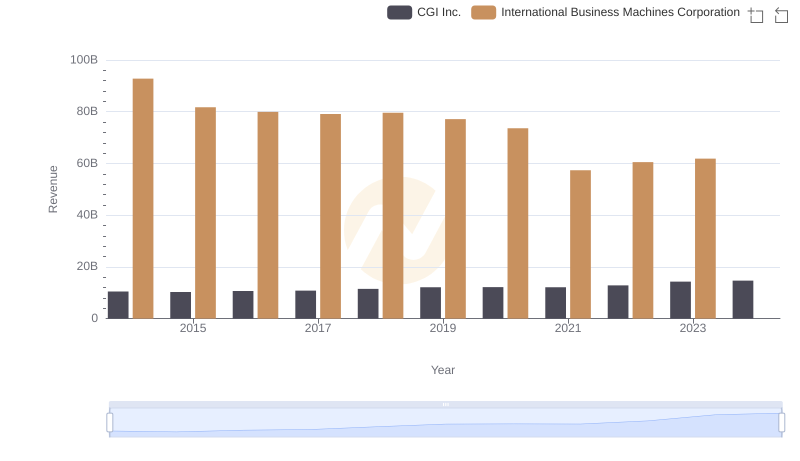
Revenue Insights: International Business Machines Corporation and CGI Inc. Performance Compared
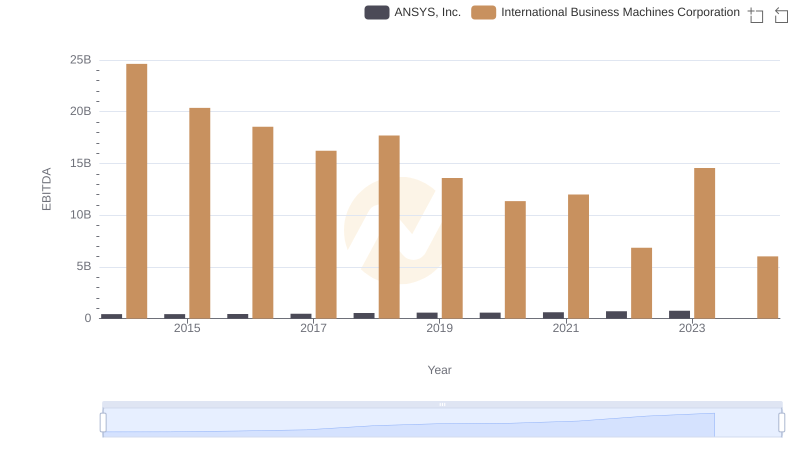
Comparative EBITDA Analysis: International Business Machines Corporation vs ANSYS, Inc.
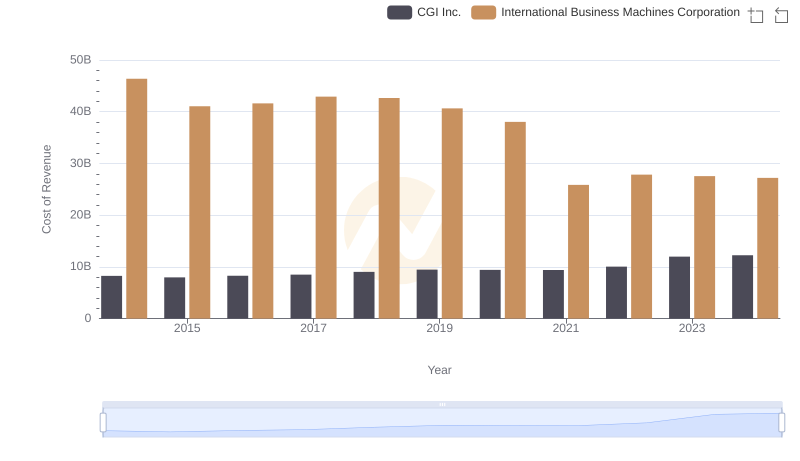
Cost of Revenue Comparison: International Business Machines Corporation vs CGI Inc.
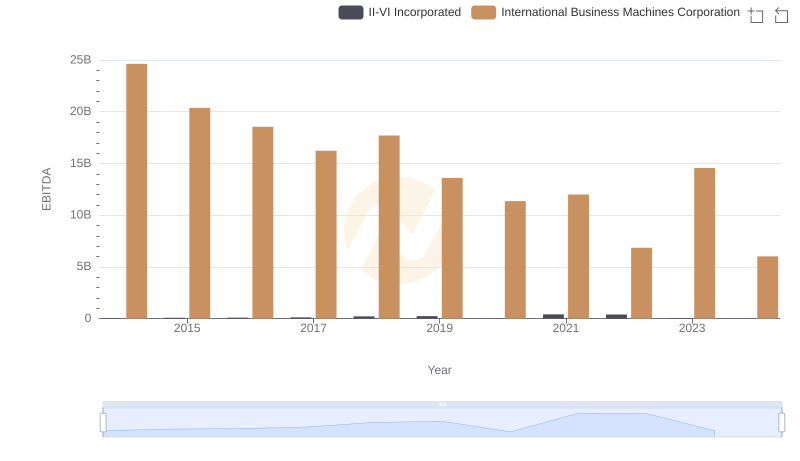
A Professional Review of EBITDA: International Business Machines Corporation Compared to II-VI Incorporated
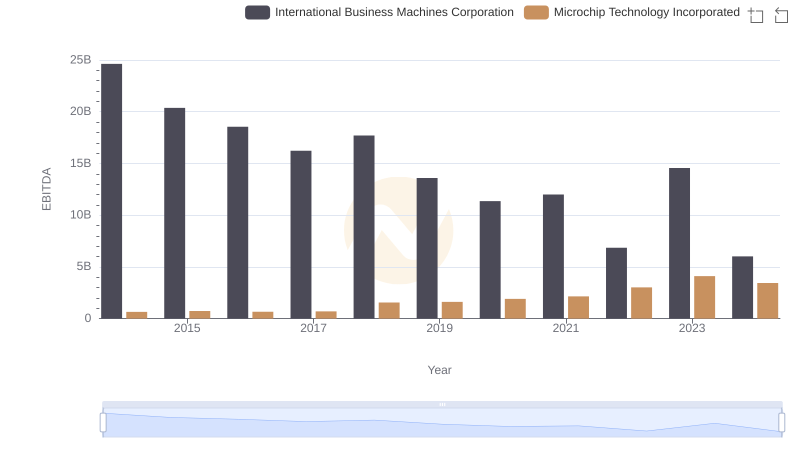
EBITDA Metrics Evaluated: International Business Machines Corporation vs Microchip Technology Incorporated
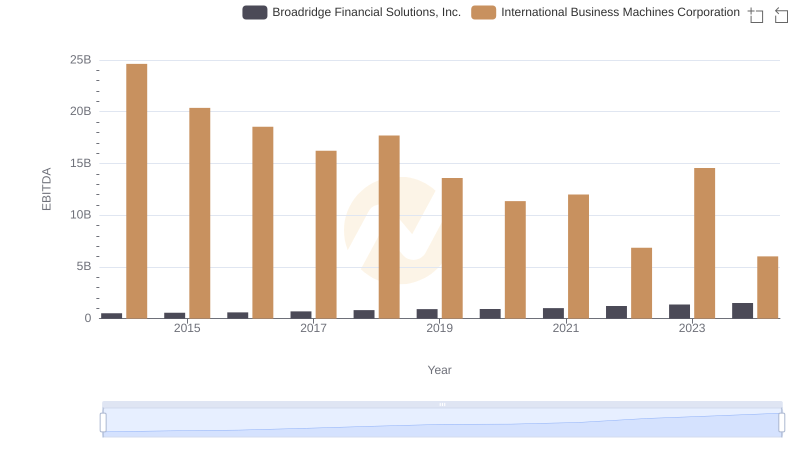
International Business Machines Corporation and Broadridge Financial Solutions, Inc.: A Detailed Examination of EBITDA Performance
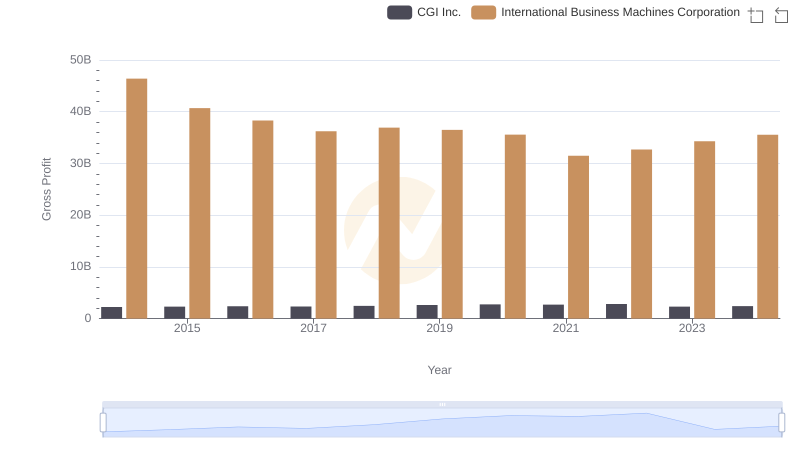
International Business Machines Corporation and CGI Inc.: A Detailed Gross Profit Analysis
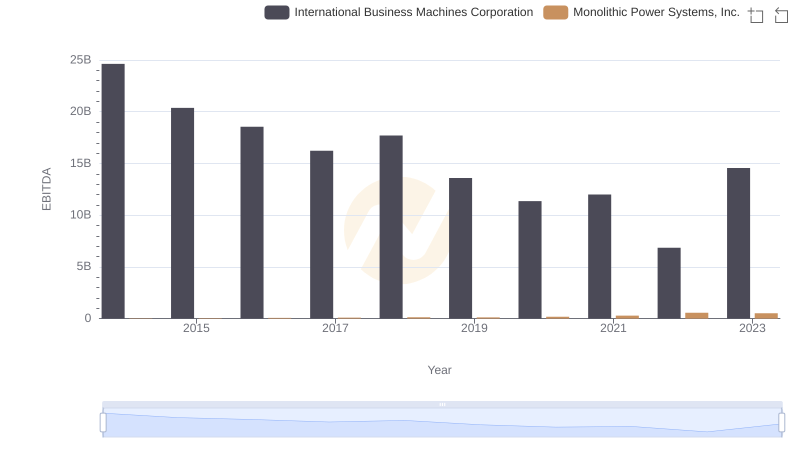
EBITDA Performance Review: International Business Machines Corporation vs Monolithic Power Systems, Inc.
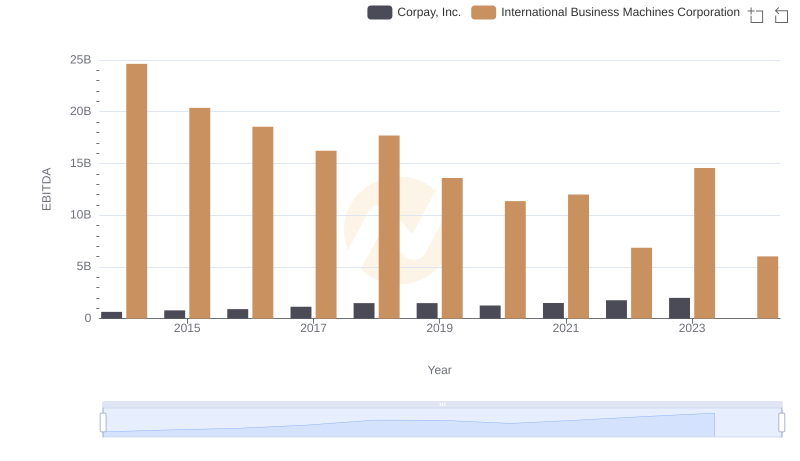
Professional EBITDA Benchmarking: International Business Machines Corporation vs Corpay, Inc.
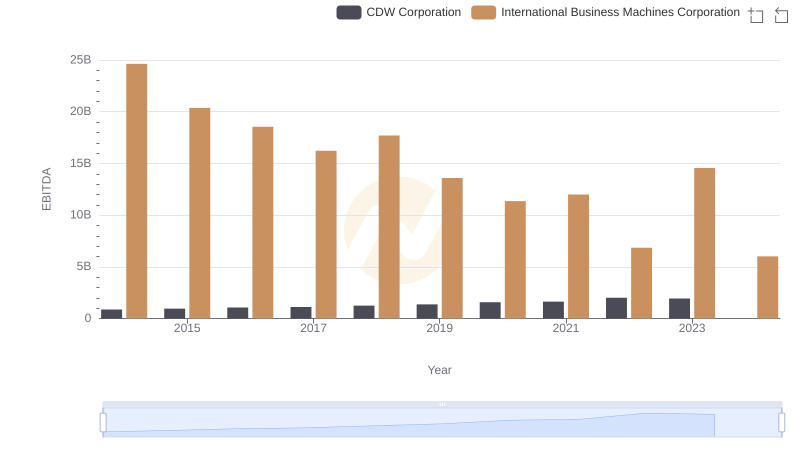
A Side-by-Side Analysis of EBITDA: International Business Machines Corporation and CDW Corporation
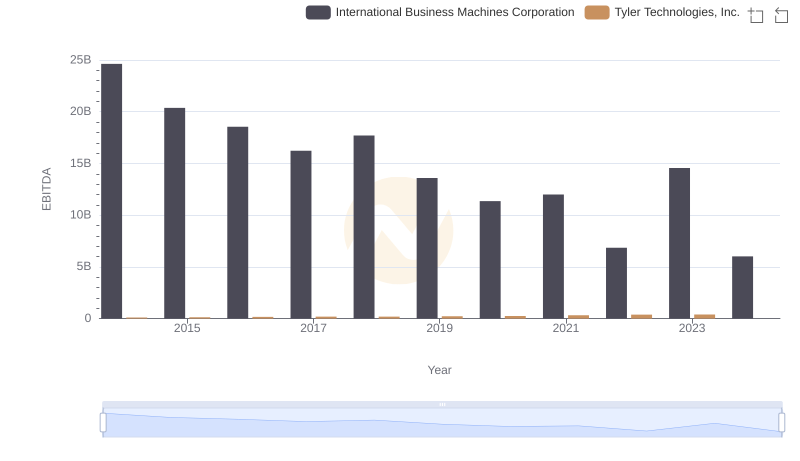
EBITDA Metrics Evaluated: International Business Machines Corporation vs Tyler Technologies, Inc.
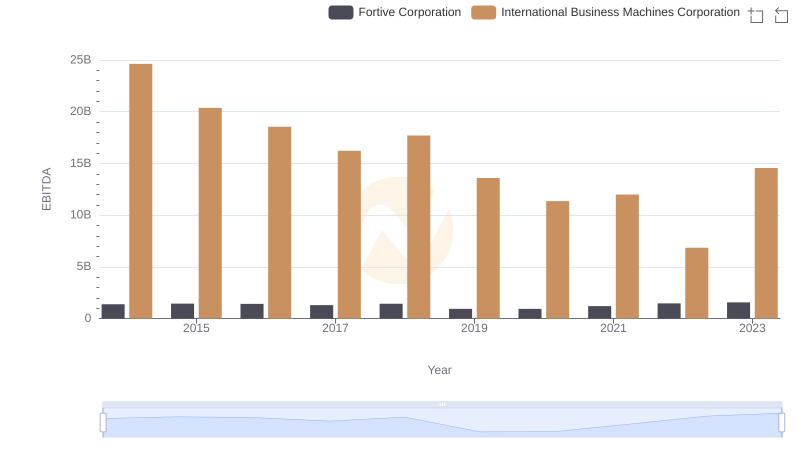
Professional EBITDA Benchmarking: International Business Machines Corporation vs Fortive Corporation