| __timestamp | II-VI Incorporated | International Business Machines Corporation |
|---|---|---|
| Wednesday, January 1, 2014 | 103218000 | 24962000000 |
| Thursday, January 1, 2015 | 136058000 | 20268000000 |
| Friday, January 1, 2016 | 149699000 | 17341000000 |
| Sunday, January 1, 2017 | 189234000 | 16556000000 |
| Monday, January 1, 2018 | 221316000 | 16545000000 |
| Tuesday, January 1, 2019 | 243595000 | 14609000000 |
| Wednesday, January 1, 2020 | 246363000 | 10555000000 |
| Friday, January 1, 2021 | 682558000 | 12409000000 |
| Saturday, January 1, 2022 | 689840000 | 7174000000 |
| Sunday, January 1, 2023 | 613001000 | 14693000000 |
| Monday, January 1, 2024 | 682936000 | 6015000000 |
Unlocking the unknown
In the ever-evolving landscape of technology and innovation, understanding financial health is crucial. This analysis delves into the EBITDA trends of two industry giants: International Business Machines Corporation (IBM) and II-VI Incorporated, from 2014 to 2023. Over this decade, IBM consistently outperformed II-VI, with EBITDA figures often exceeding II-VI's by over 1000%. However, II-VI showed remarkable growth, with a 700% increase in EBITDA from 2014 to 2021, peaking in 2021. In contrast, IBM's EBITDA saw a decline of approximately 40% from its 2014 peak. Notably, 2023 marked a resurgence for IBM, with a 113% increase from the previous year, while II-VI experienced a significant drop. This data highlights the dynamic nature of the tech industry, where strategic pivots and market conditions can dramatically alter financial trajectories.
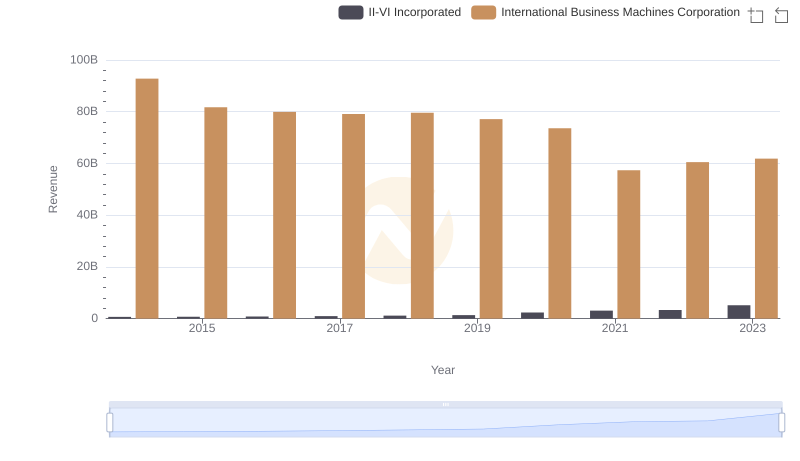
Breaking Down Revenue Trends: International Business Machines Corporation vs II-VI Incorporated
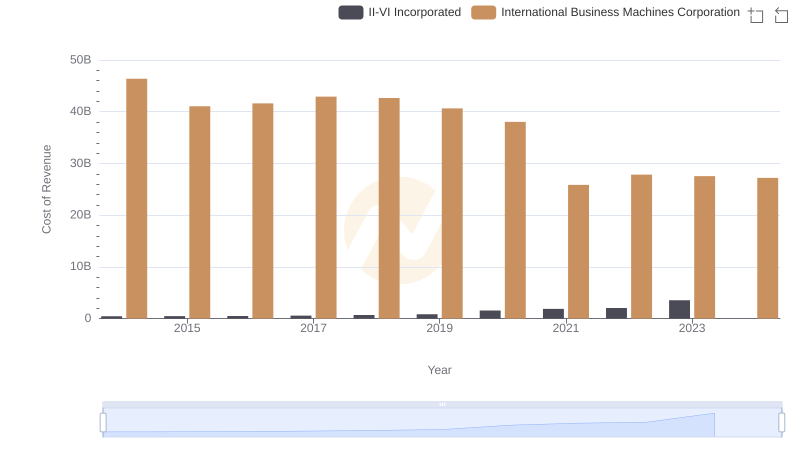
Analyzing Cost of Revenue: International Business Machines Corporation and II-VI Incorporated
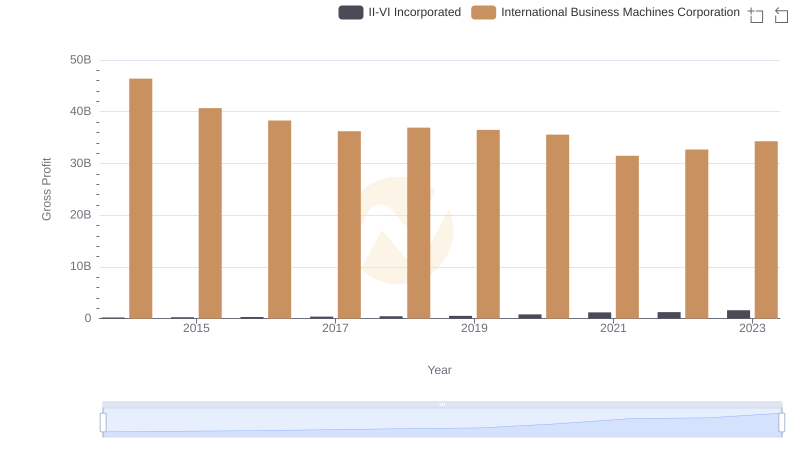
Gross Profit Trends Compared: International Business Machines Corporation vs II-VI Incorporated
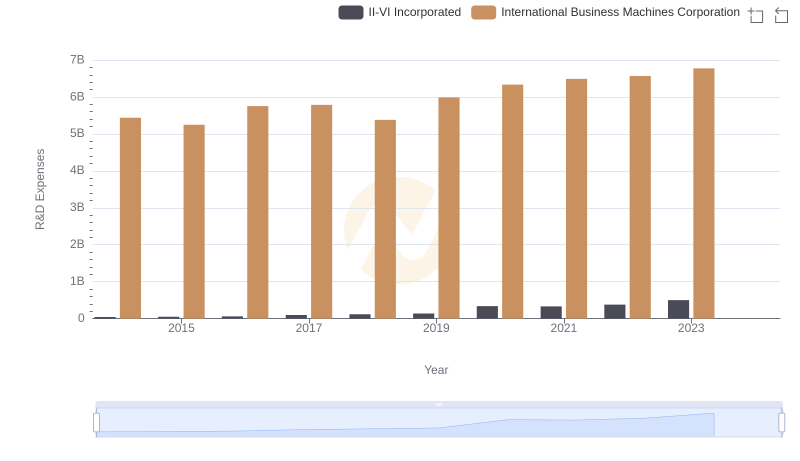
Research and Development Investment: International Business Machines Corporation vs II-VI Incorporated
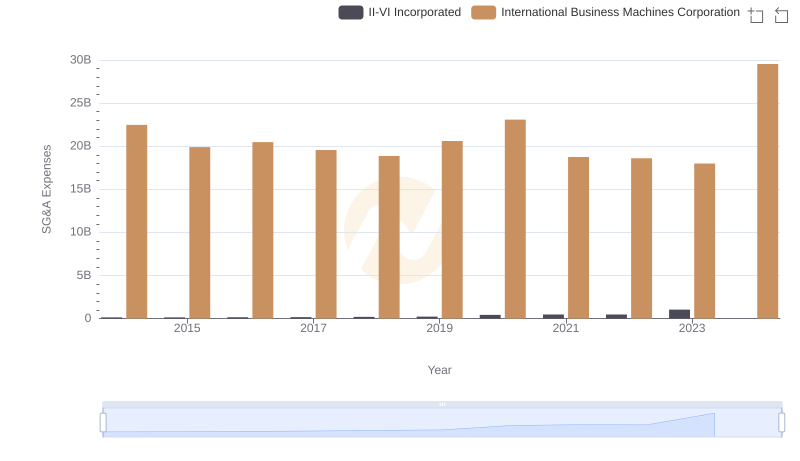
SG&A Efficiency Analysis: Comparing International Business Machines Corporation and II-VI Incorporated
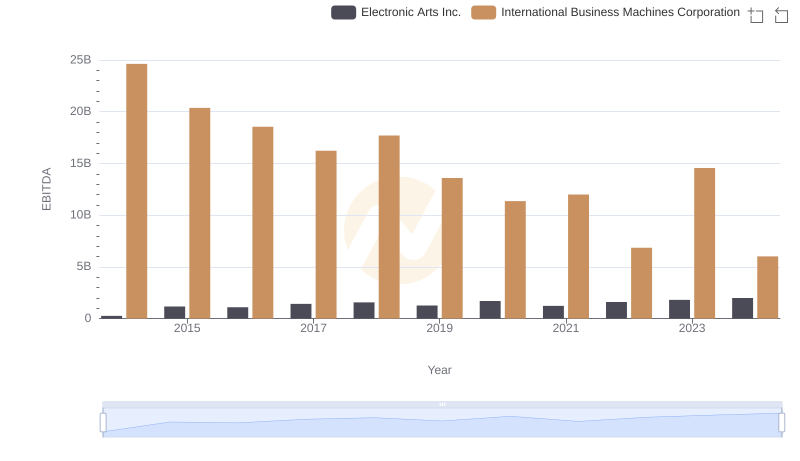
EBITDA Performance Review: International Business Machines Corporation vs Electronic Arts Inc.
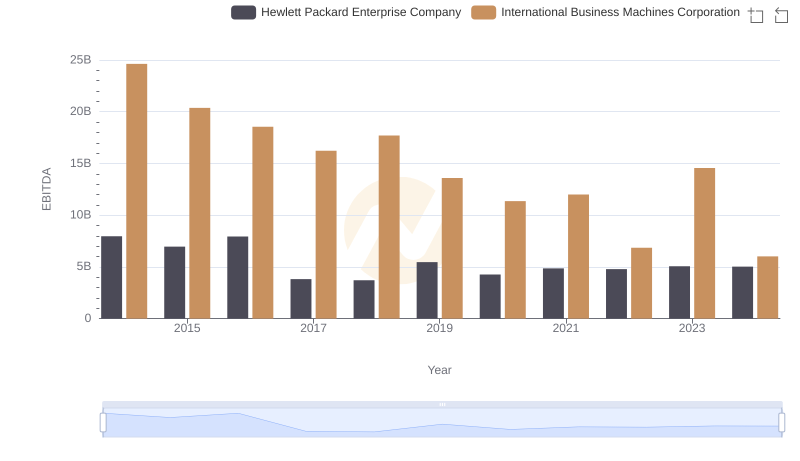
A Side-by-Side Analysis of EBITDA: International Business Machines Corporation and Hewlett Packard Enterprise Company
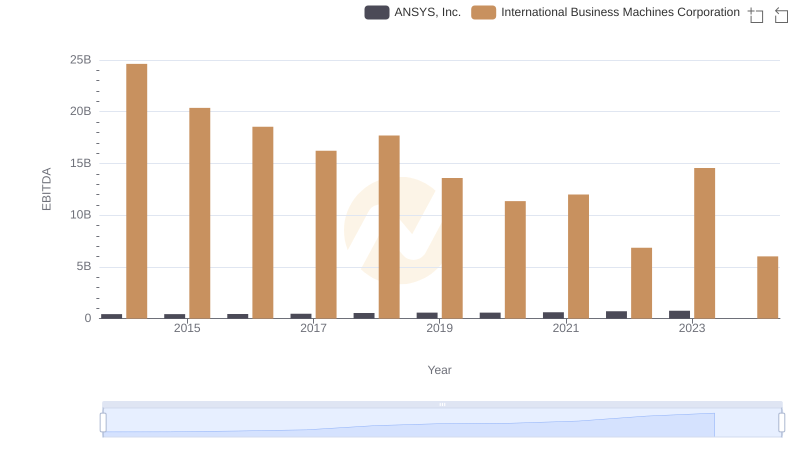
Comparative EBITDA Analysis: International Business Machines Corporation vs ANSYS, Inc.
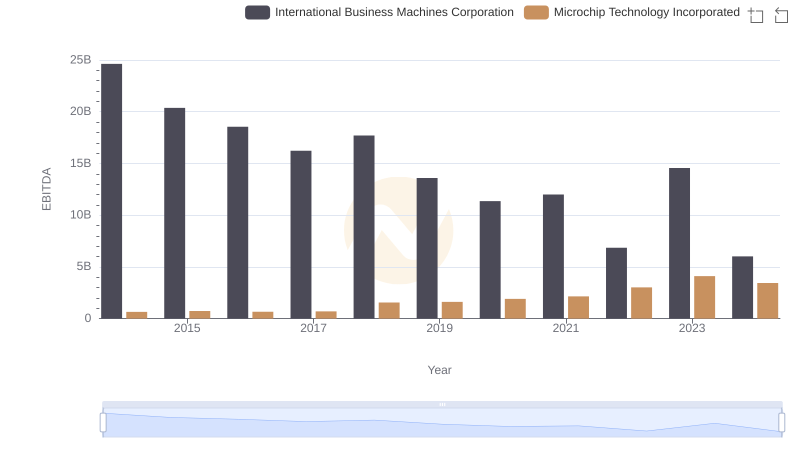
EBITDA Metrics Evaluated: International Business Machines Corporation vs Microchip Technology Incorporated
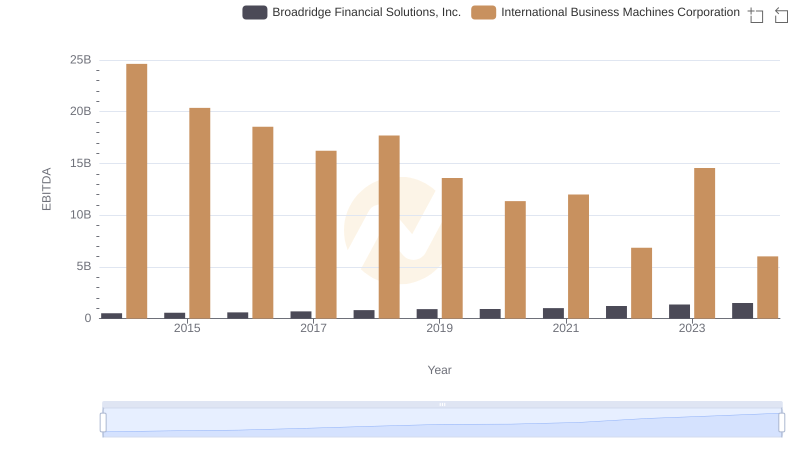
International Business Machines Corporation and Broadridge Financial Solutions, Inc.: A Detailed Examination of EBITDA Performance
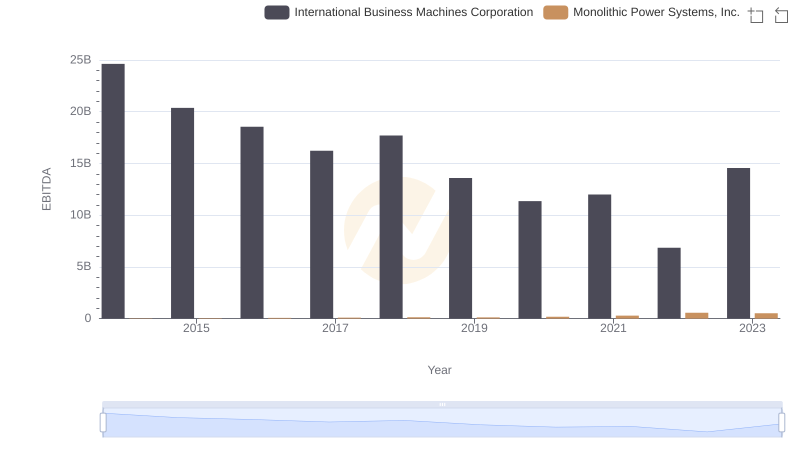
EBITDA Performance Review: International Business Machines Corporation vs Monolithic Power Systems, Inc.
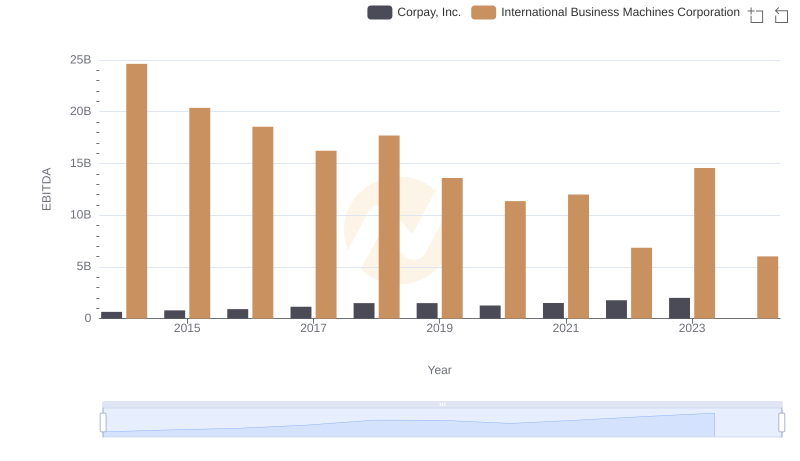
Professional EBITDA Benchmarking: International Business Machines Corporation vs Corpay, Inc.