| __timestamp | CGI Inc. | International Business Machines Corporation |
|---|---|---|
| Wednesday, January 1, 2014 | 10499692000 | 92793000000 |
| Thursday, January 1, 2015 | 10287096000 | 81742000000 |
| Friday, January 1, 2016 | 10683264000 | 79920000000 |
| Sunday, January 1, 2017 | 10845066000 | 79139000000 |
| Monday, January 1, 2018 | 11506825000 | 79591000000 |
| Tuesday, January 1, 2019 | 12111236000 | 57714000000 |
| Wednesday, January 1, 2020 | 12164115000 | 55179000000 |
| Friday, January 1, 2021 | 12126793000 | 57351000000 |
| Saturday, January 1, 2022 | 12867201000 | 60530000000 |
| Sunday, January 1, 2023 | 14296360000 | 61860000000 |
| Monday, January 1, 2024 | 14676152000 | 62753000000 |
Unleashing the power of data
In the ever-evolving landscape of technology giants, International Business Machines Corporation (IBM) and CGI Inc. have showcased intriguing revenue trajectories over the past decade. From 2014 to 2024, IBM's revenue has seen a notable decline of approximately 32%, dropping from its peak in 2014. In contrast, CGI Inc. has experienced a robust growth of around 40% during the same period, reflecting its strategic expansion and market adaptability.
IBM, once a dominant force, has faced challenges adapting to the rapidly changing tech environment, as evidenced by its revenue dip from 2014's high of 92.8 billion to 62.8 billion in 2024. Meanwhile, CGI Inc. has steadily climbed from 10.5 billion in 2014 to 14.7 billion in 2024, capitalizing on its agile business model and expanding global footprint. This comparison highlights the dynamic nature of the tech industry and the importance of innovation and adaptability.
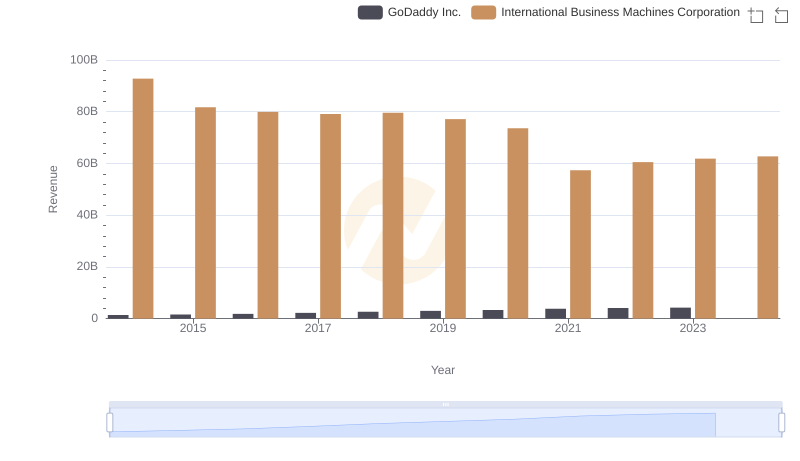
Who Generates More Revenue? International Business Machines Corporation or GoDaddy Inc.
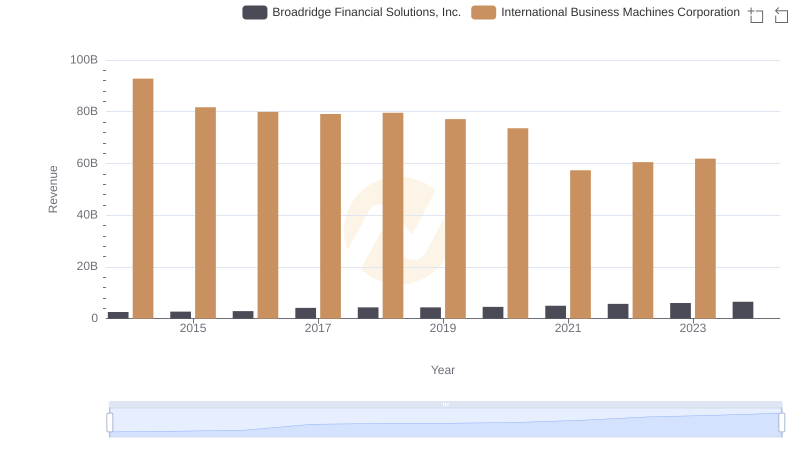
Revenue Insights: International Business Machines Corporation and Broadridge Financial Solutions, Inc. Performance Compared
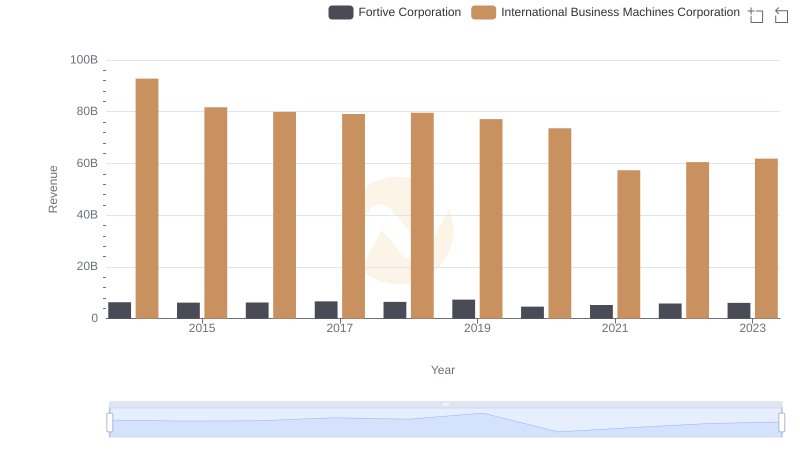
Annual Revenue Comparison: International Business Machines Corporation vs Fortive Corporation
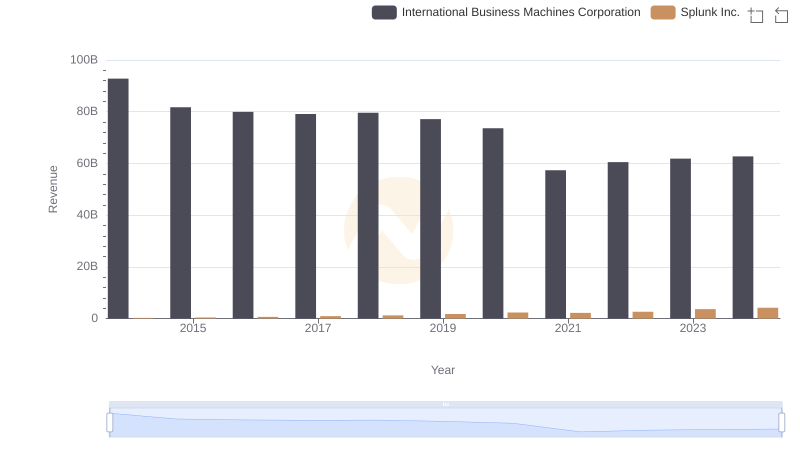
Comparing Revenue Performance: International Business Machines Corporation or Splunk Inc.?
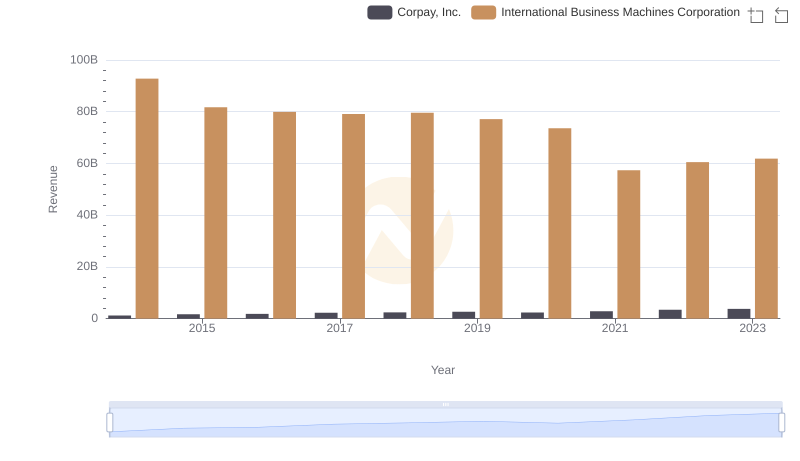
Comparing Revenue Performance: International Business Machines Corporation or Corpay, Inc.?
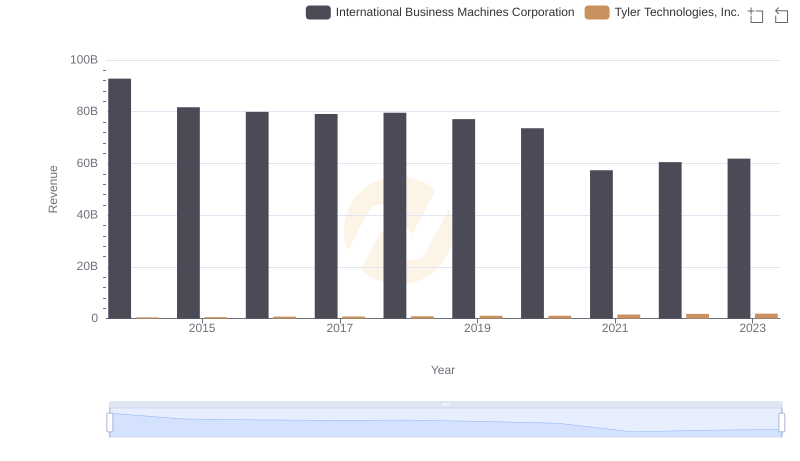
International Business Machines Corporation vs Tyler Technologies, Inc.: Examining Key Revenue Metrics
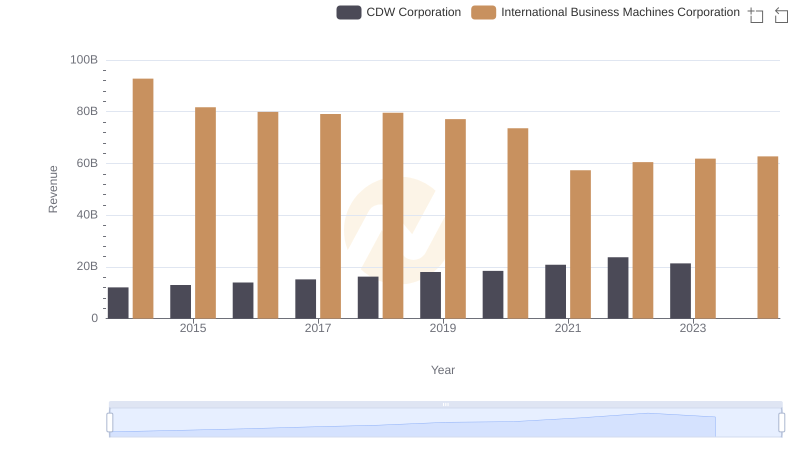
Who Generates More Revenue? International Business Machines Corporation or CDW Corporation
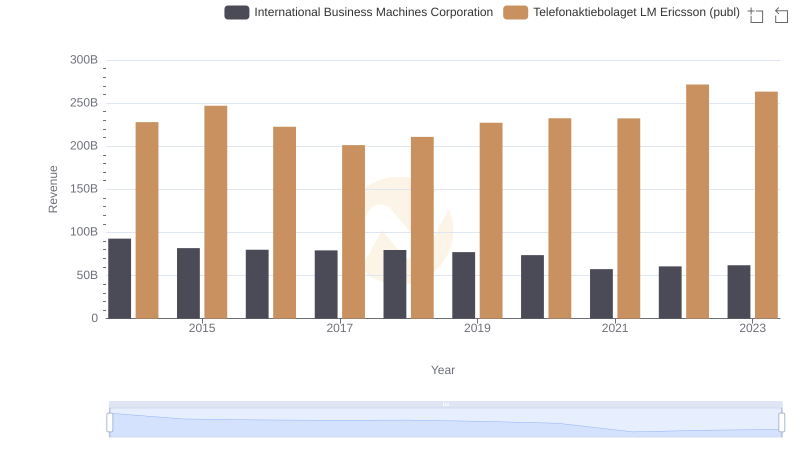
Comparing Revenue Performance: International Business Machines Corporation or Telefonaktiebolaget LM Ericsson (publ)?
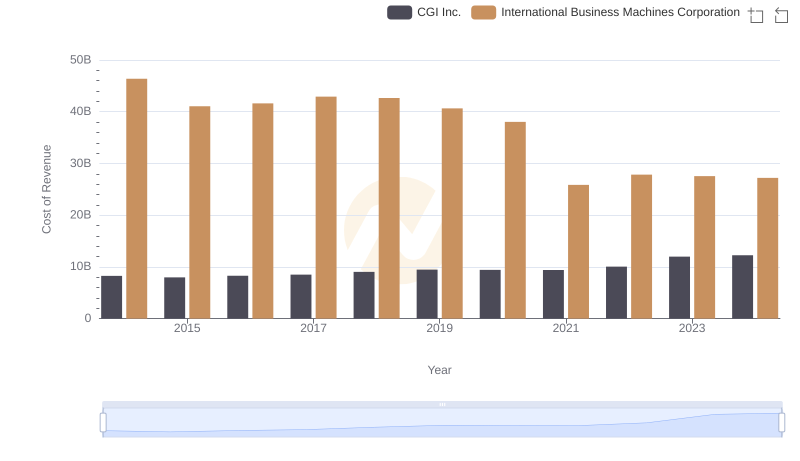
Cost of Revenue Comparison: International Business Machines Corporation vs CGI Inc.
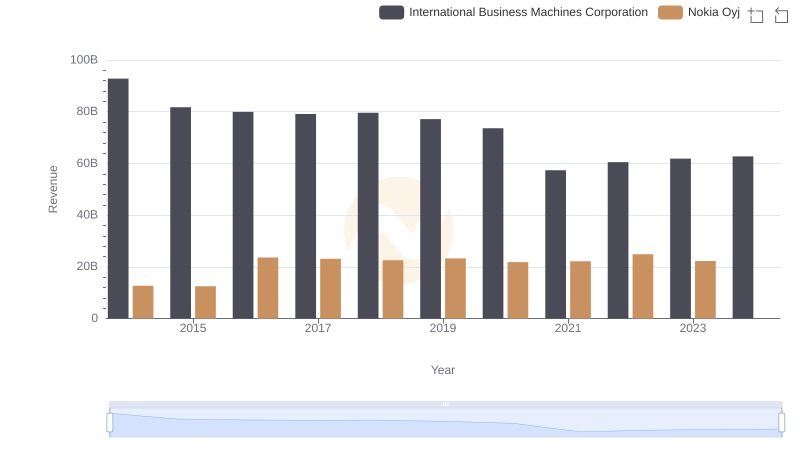
International Business Machines Corporation or Nokia Oyj: Who Leads in Yearly Revenue?
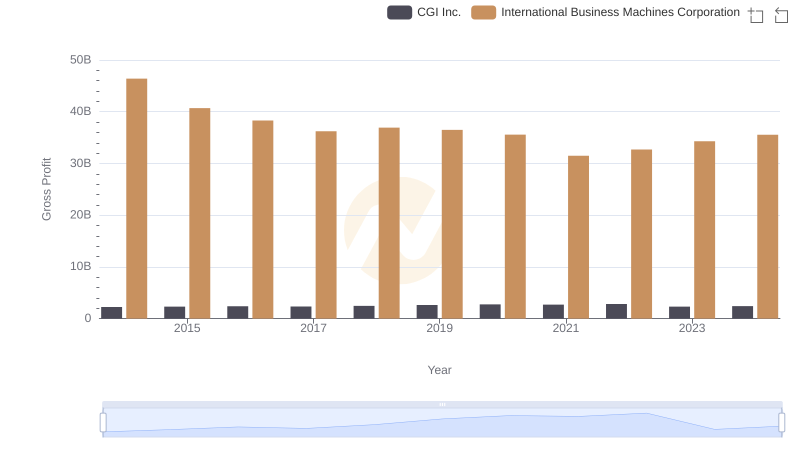
International Business Machines Corporation and CGI Inc.: A Detailed Gross Profit Analysis
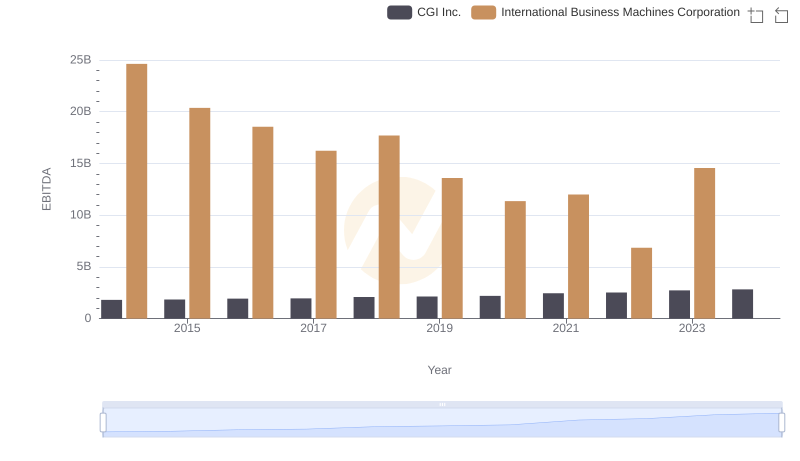
Comprehensive EBITDA Comparison: International Business Machines Corporation vs CGI Inc.