| __timestamp | CGI Inc. | International Business Machines Corporation |
|---|---|---|
| Wednesday, January 1, 2014 | 2236386000 | 46407000000 |
| Thursday, January 1, 2015 | 2306911000 | 40684000000 |
| Friday, January 1, 2016 | 2389857000 | 38516000000 |
| Sunday, January 1, 2017 | 2344241000 | 36943000000 |
| Monday, January 1, 2018 | 2461165000 | 36936000000 |
| Tuesday, January 1, 2019 | 2639575000 | 31533000000 |
| Wednesday, January 1, 2020 | 2743715000 | 30865000000 |
| Friday, January 1, 2021 | 2716822000 | 31486000000 |
| Saturday, January 1, 2022 | 2819052000 | 32687000000 |
| Sunday, January 1, 2023 | 2313939000 | 34300000000 |
| Monday, January 1, 2024 | 2416422000 | 35551000000 |
Unveiling the hidden dimensions of data
In the ever-evolving landscape of technology giants, International Business Machines Corporation (IBM) and CGI Inc. have consistently demonstrated their prowess. From 2014 to 2024, IBM's gross profit has shown a notable decline of approximately 23%, from a peak of $46 billion in 2014 to $35.5 billion in 2024. This trend reflects the challenges faced by traditional tech behemoths in adapting to new market dynamics.
Conversely, CGI Inc. has experienced a steady growth trajectory, with its gross profit increasing by around 8% over the same period, reaching $2.4 billion in 2024. This growth underscores CGI's strategic adaptability and its ability to capitalize on emerging opportunities in the tech sector.
These contrasting trends highlight the shifting paradigms within the industry, where agility and innovation are key to sustaining profitability.
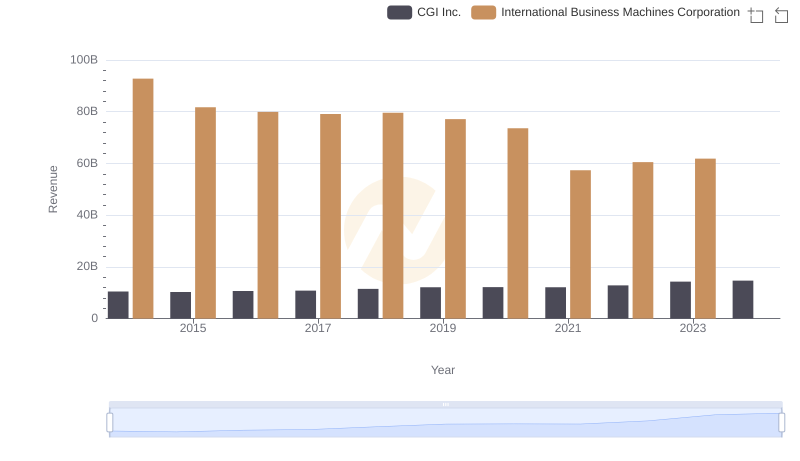
Revenue Insights: International Business Machines Corporation and CGI Inc. Performance Compared
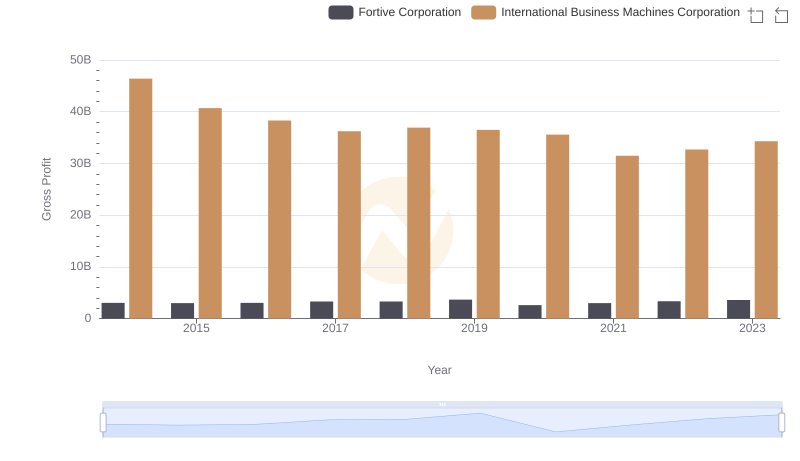
International Business Machines Corporation and Fortive Corporation: A Detailed Gross Profit Analysis
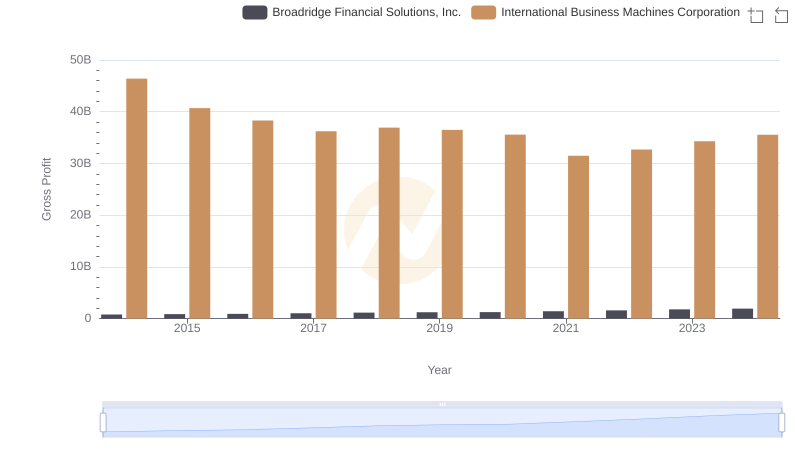
Gross Profit Trends Compared: International Business Machines Corporation vs Broadridge Financial Solutions, Inc.
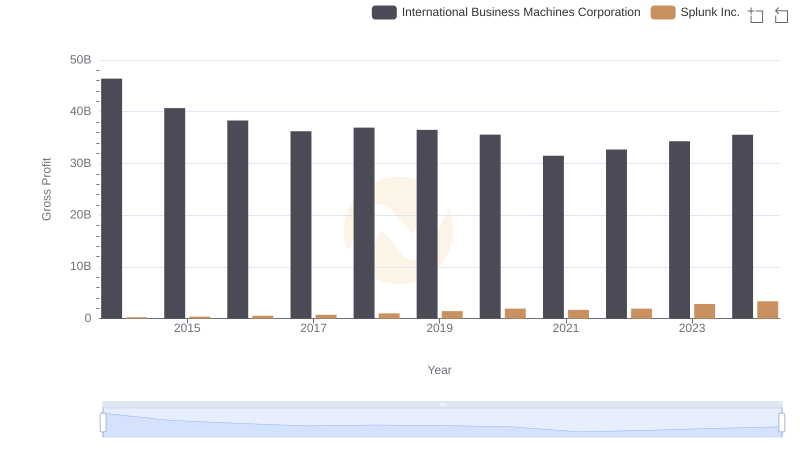
Gross Profit Trends Compared: International Business Machines Corporation vs Splunk Inc.
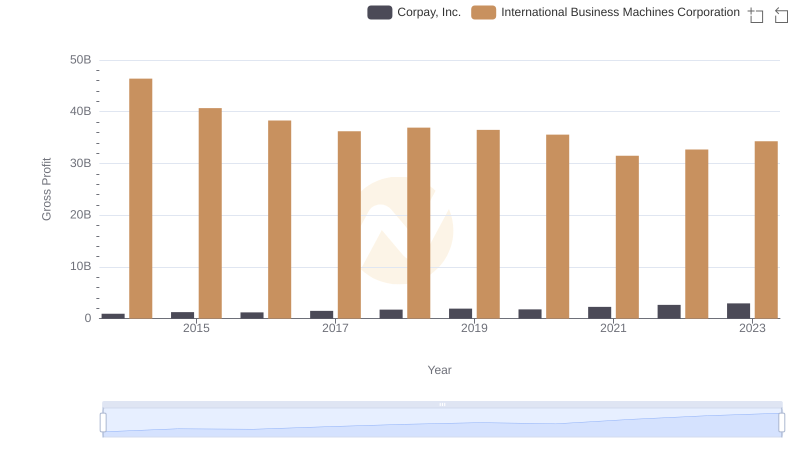
Who Generates Higher Gross Profit? International Business Machines Corporation or Corpay, Inc.
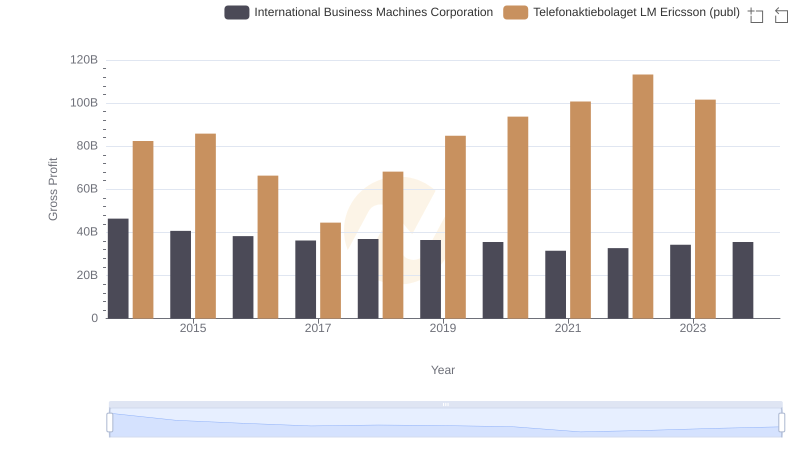
Key Insights on Gross Profit: International Business Machines Corporation vs Telefonaktiebolaget LM Ericsson (publ)
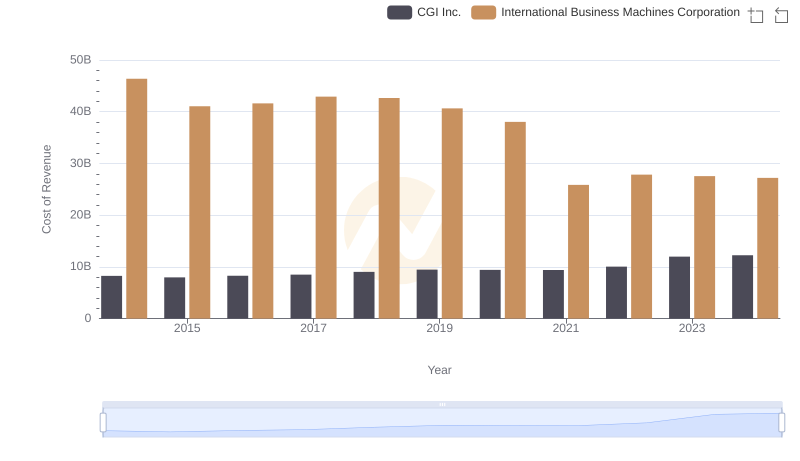
Cost of Revenue Comparison: International Business Machines Corporation vs CGI Inc.
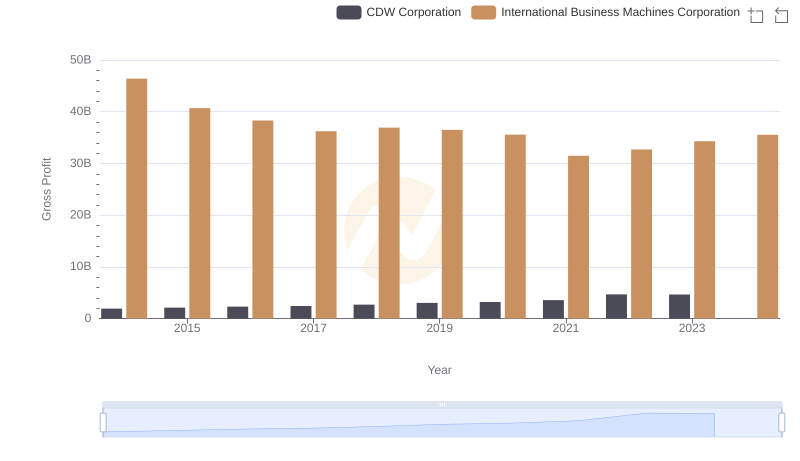
Gross Profit Comparison: International Business Machines Corporation and CDW Corporation Trends
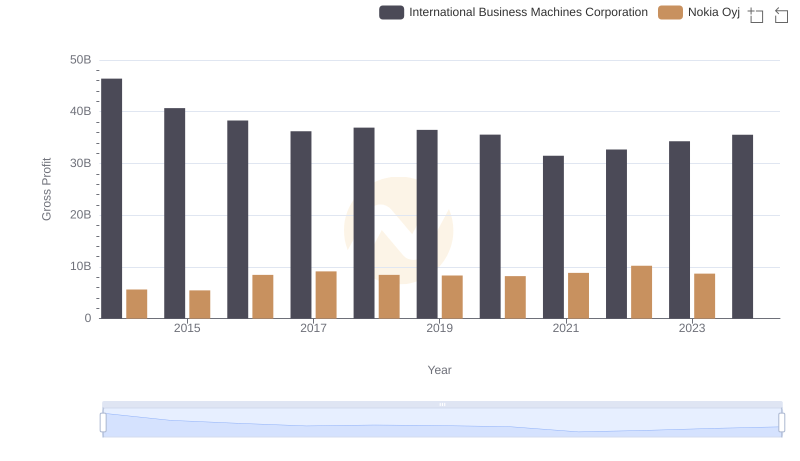
Gross Profit Comparison: International Business Machines Corporation and Nokia Oyj Trends
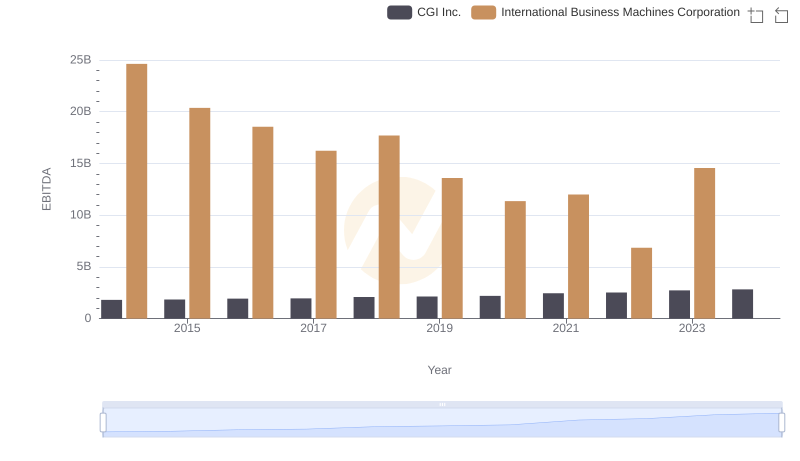
Comprehensive EBITDA Comparison: International Business Machines Corporation vs CGI Inc.

Gross Profit Trends Compared: International Business Machines Corporation vs NetApp, Inc.
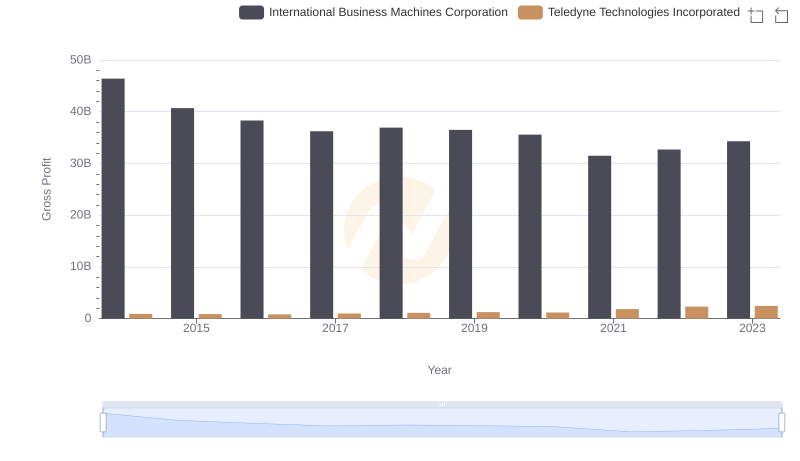
International Business Machines Corporation and Teledyne Technologies Incorporated: A Detailed Gross Profit Analysis