| __timestamp | CDW Corporation | International Business Machines Corporation |
|---|---|---|
| Wednesday, January 1, 2014 | 880900000 | 24962000000 |
| Thursday, January 1, 2015 | 969400000 | 20268000000 |
| Friday, January 1, 2016 | 1074500000 | 17341000000 |
| Sunday, January 1, 2017 | 1127400000 | 16556000000 |
| Monday, January 1, 2018 | 1252900000 | 16545000000 |
| Tuesday, January 1, 2019 | 1371100000 | 14609000000 |
| Wednesday, January 1, 2020 | 1588200000 | 10555000000 |
| Friday, January 1, 2021 | 1642200000 | 12409000000 |
| Saturday, January 1, 2022 | 2018100000 | 7174000000 |
| Sunday, January 1, 2023 | 1947800000 | 14693000000 |
| Monday, January 1, 2024 | 1651300000 | 6015000000 |
Unleashing the power of data
In the ever-evolving landscape of technology and business services, International Business Machines Corporation (IBM) and CDW Corporation stand as titans. Over the past decade, their EBITDA trends reveal intriguing insights into their financial health and strategic maneuvers. From 2014 to 2023, IBM's EBITDA has seen a significant decline of approximately 41%, dropping from a peak in 2014 to a low in 2022. This reflects the challenges IBM faced in adapting to the rapidly changing tech environment. In contrast, CDW's EBITDA has surged by over 120% during the same period, showcasing its robust growth strategy and market adaptability. Notably, 2022 marked a pivotal year where CDW's EBITDA nearly tripled compared to its 2014 figures, while IBM hit its lowest point. As we look to the future, these trends underscore the dynamic nature of the tech industry and the importance of strategic agility.
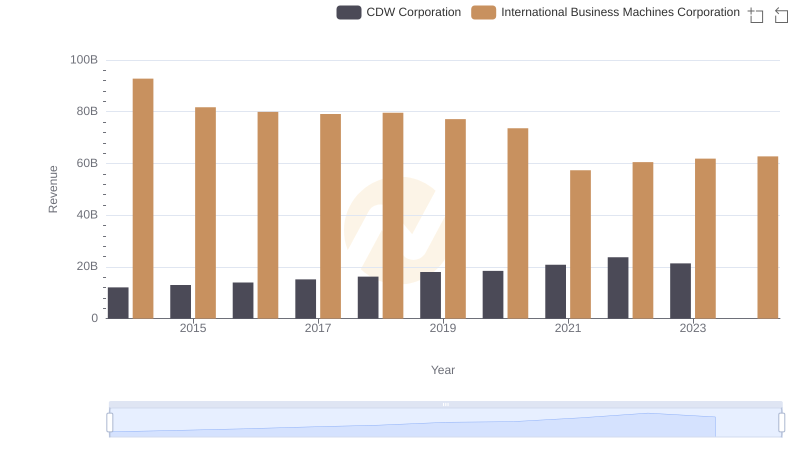
Who Generates More Revenue? International Business Machines Corporation or CDW Corporation
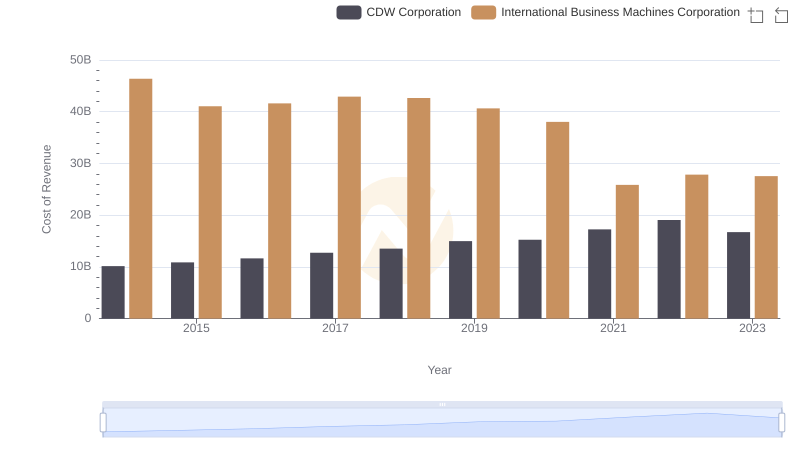
Analyzing Cost of Revenue: International Business Machines Corporation and CDW Corporation
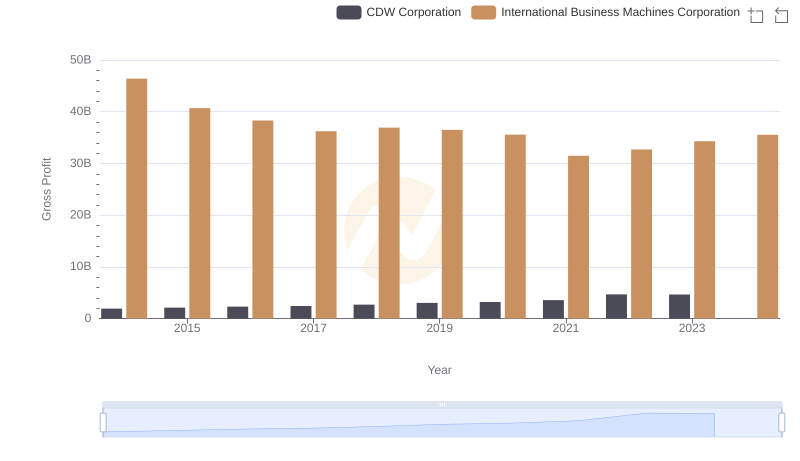
Gross Profit Comparison: International Business Machines Corporation and CDW Corporation Trends
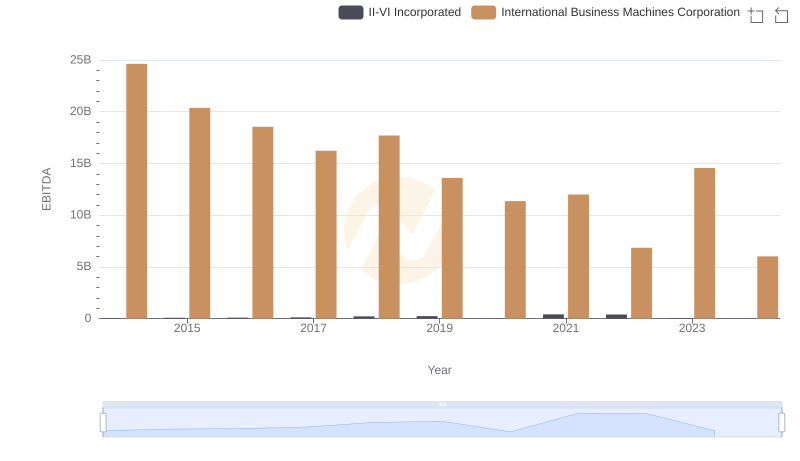
A Professional Review of EBITDA: International Business Machines Corporation Compared to II-VI Incorporated
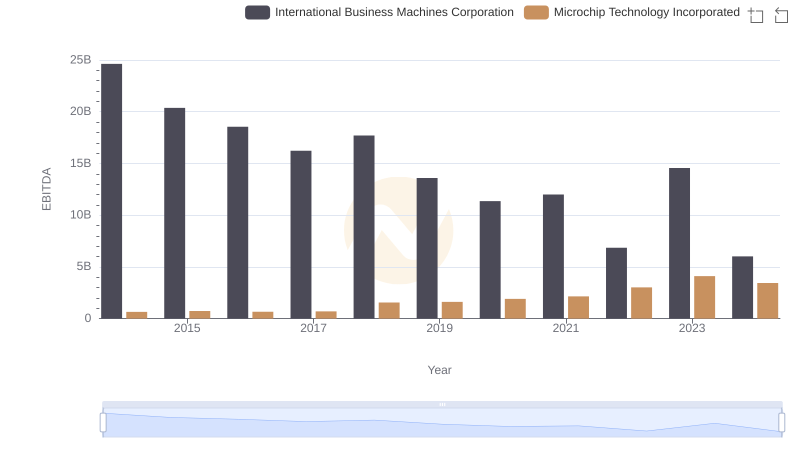
EBITDA Metrics Evaluated: International Business Machines Corporation vs Microchip Technology Incorporated
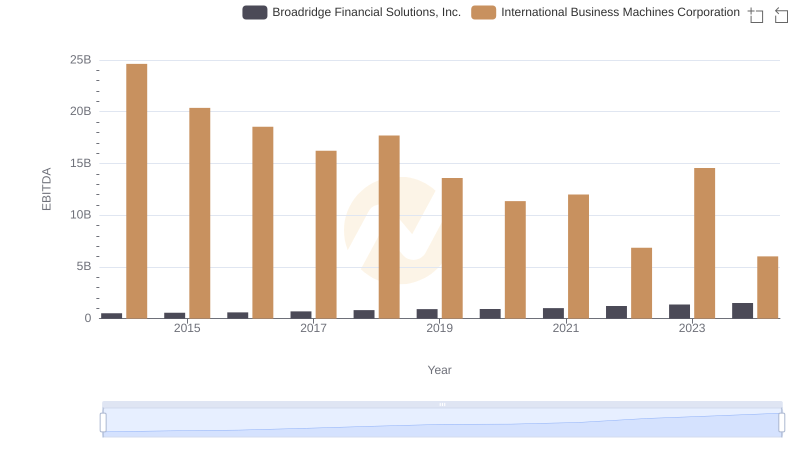
International Business Machines Corporation and Broadridge Financial Solutions, Inc.: A Detailed Examination of EBITDA Performance
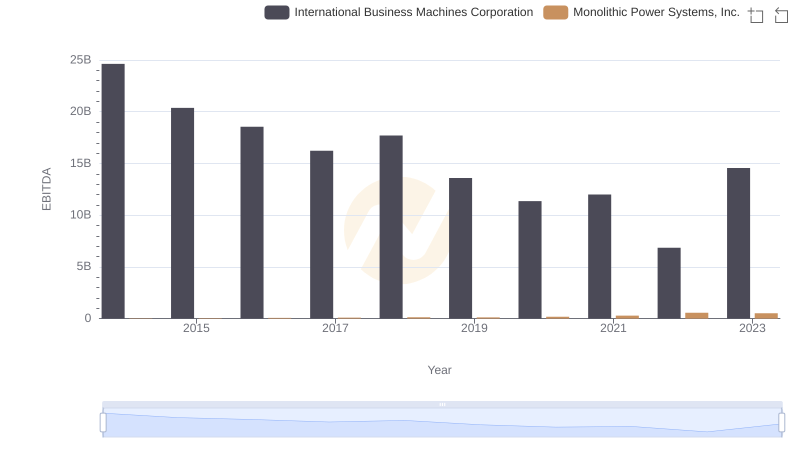
EBITDA Performance Review: International Business Machines Corporation vs Monolithic Power Systems, Inc.
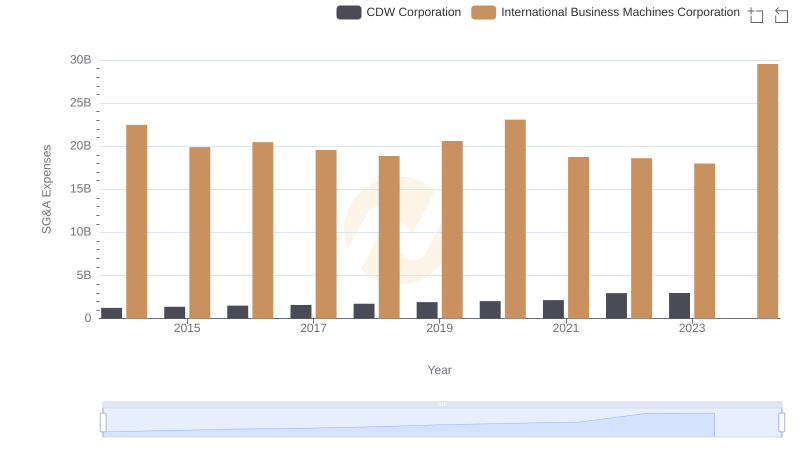
International Business Machines Corporation vs CDW Corporation: SG&A Expense Trends
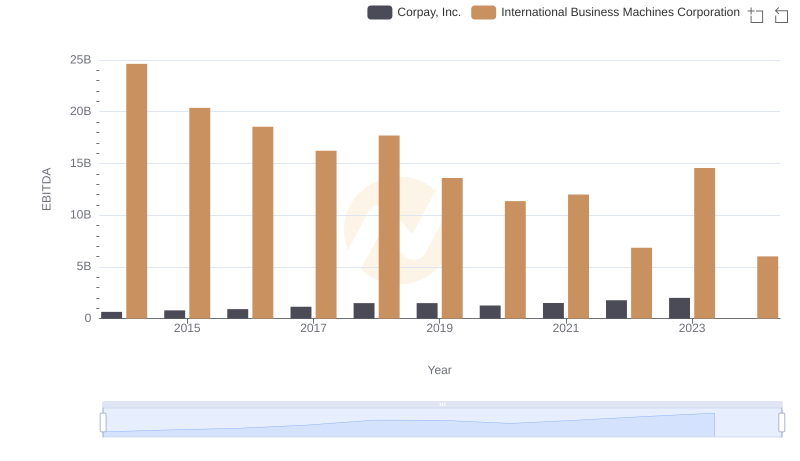
Professional EBITDA Benchmarking: International Business Machines Corporation vs Corpay, Inc.
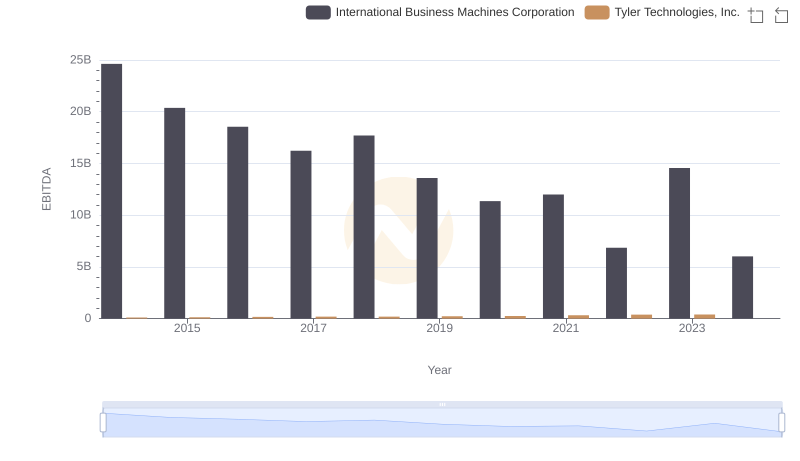
EBITDA Metrics Evaluated: International Business Machines Corporation vs Tyler Technologies, Inc.
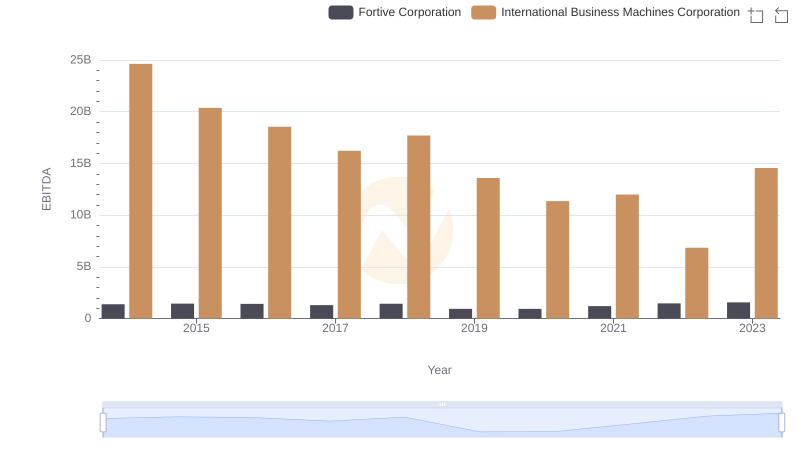
Professional EBITDA Benchmarking: International Business Machines Corporation vs Fortive Corporation
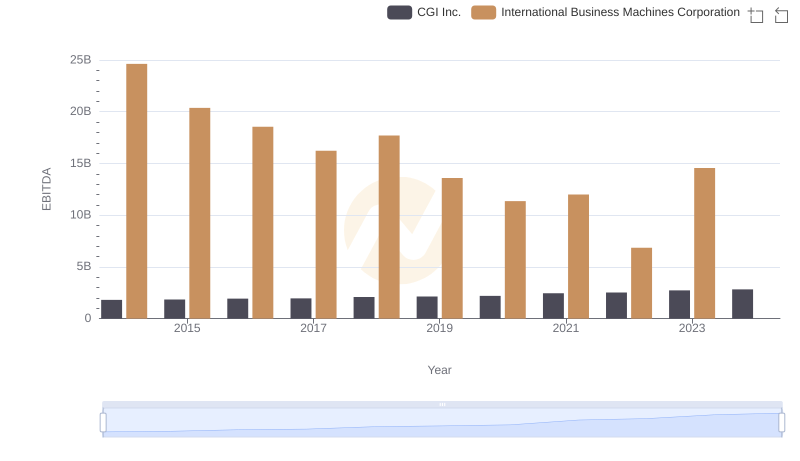
Comprehensive EBITDA Comparison: International Business Machines Corporation vs CGI Inc.