| __timestamp | Fortive Corporation | International Business Machines Corporation |
|---|---|---|
| Wednesday, January 1, 2014 | 1389400000 | 24962000000 |
| Thursday, January 1, 2015 | 1446600000 | 20268000000 |
| Friday, January 1, 2016 | 1422400000 | 17341000000 |
| Sunday, January 1, 2017 | 1301300000 | 16556000000 |
| Monday, January 1, 2018 | 1436200000 | 16545000000 |
| Tuesday, January 1, 2019 | 936100000 | 14609000000 |
| Wednesday, January 1, 2020 | 947800000 | 10555000000 |
| Friday, January 1, 2021 | 1206100000 | 12409000000 |
| Saturday, January 1, 2022 | 1471300000 | 7174000000 |
| Sunday, January 1, 2023 | 1571100000 | 14693000000 |
| Monday, January 1, 2024 | 1206600000 | 6015000000 |
In pursuit of knowledge
In the ever-evolving landscape of global business, understanding the financial health of industry giants is crucial. This analysis delves into the EBITDA performance of International Business Machines Corporation (IBM) and Fortive Corporation from 2014 to 2023. Over this period, IBM's EBITDA showcased a significant decline, dropping from a peak of approximately $24.6 billion in 2014 to a low of $6.9 billion in 2022, before rebounding to $14.6 billion in 2023. This represents a dramatic 72% decrease at its lowest point, highlighting the challenges faced by the tech behemoth.
Conversely, Fortive Corporation demonstrated a more stable trajectory, with EBITDA figures fluctuating modestly around the $1.3 billion mark. Notably, Fortive's EBITDA increased by 13% from 2014 to 2023, reaching $1.57 billion. This stability underscores Fortive's resilience and strategic positioning in the market. As businesses navigate the complexities of the modern economy, these insights offer valuable lessons in adaptability and financial management.
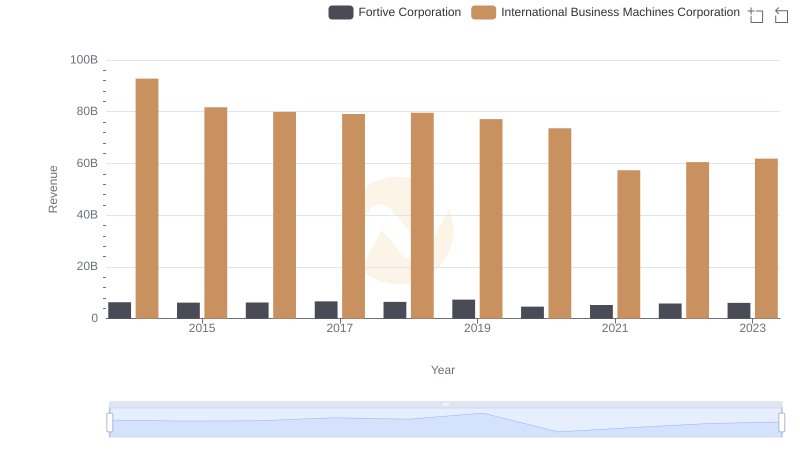
Annual Revenue Comparison: International Business Machines Corporation vs Fortive Corporation
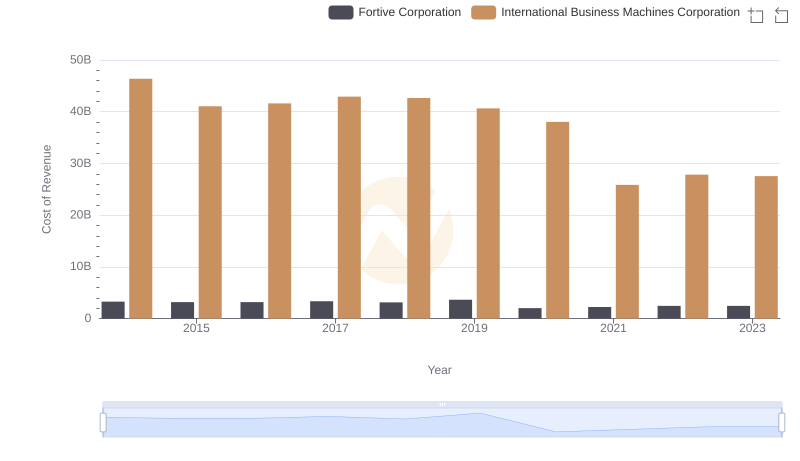
Cost of Revenue Comparison: International Business Machines Corporation vs Fortive Corporation
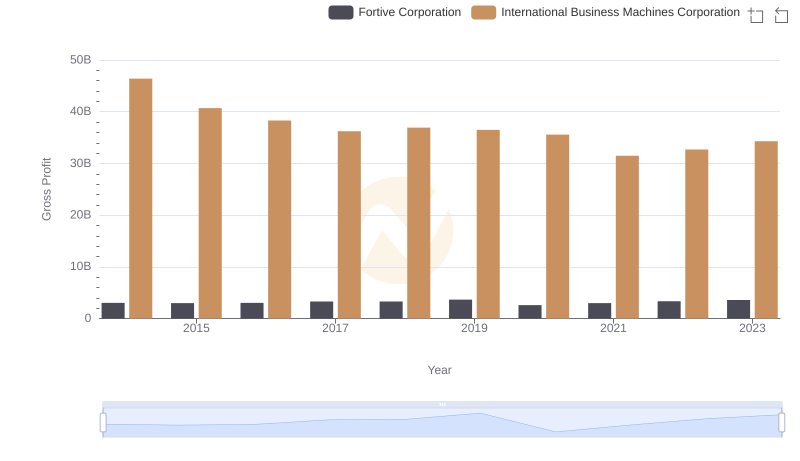
International Business Machines Corporation and Fortive Corporation: A Detailed Gross Profit Analysis
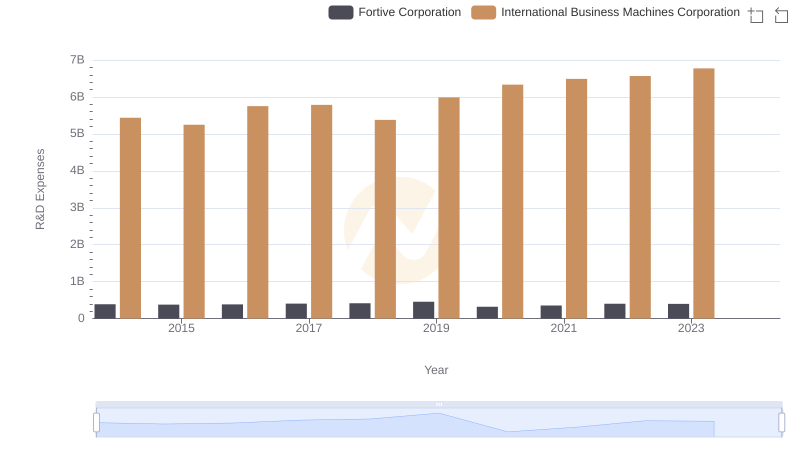
International Business Machines Corporation or Fortive Corporation: Who Invests More in Innovation?
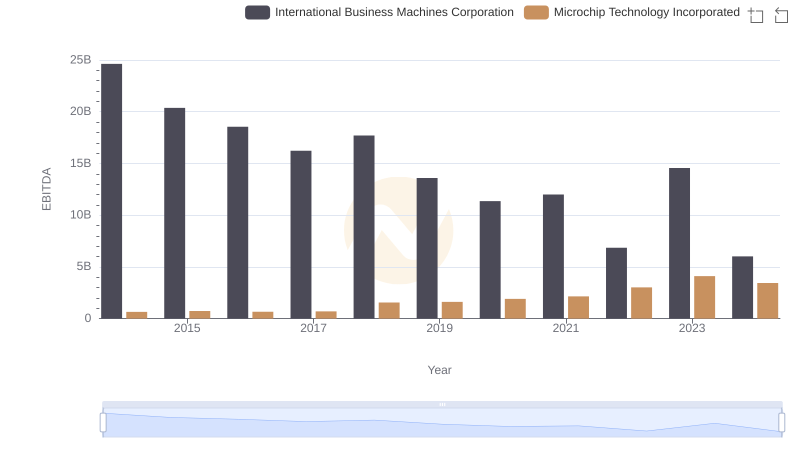
EBITDA Metrics Evaluated: International Business Machines Corporation vs Microchip Technology Incorporated
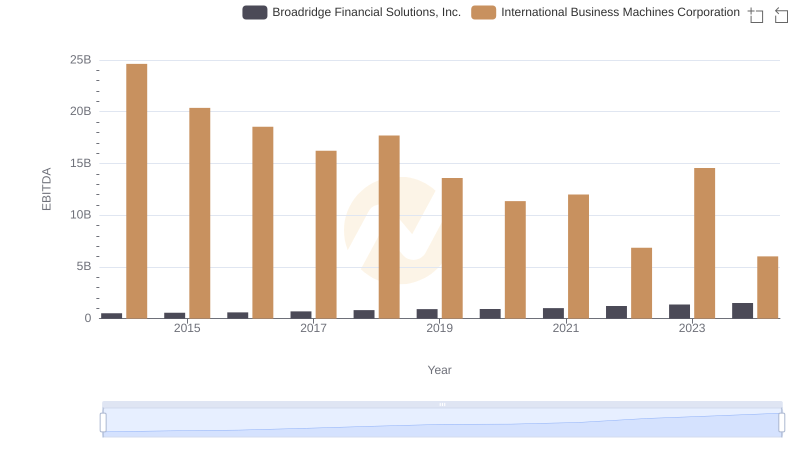
International Business Machines Corporation and Broadridge Financial Solutions, Inc.: A Detailed Examination of EBITDA Performance
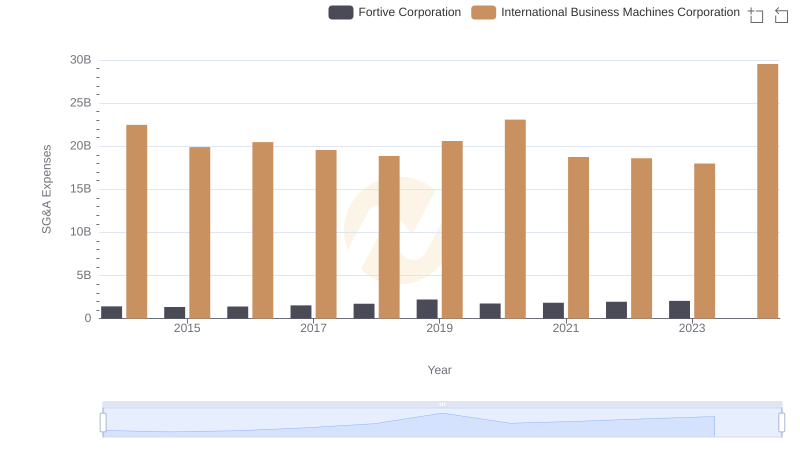
Who Optimizes SG&A Costs Better? International Business Machines Corporation or Fortive Corporation
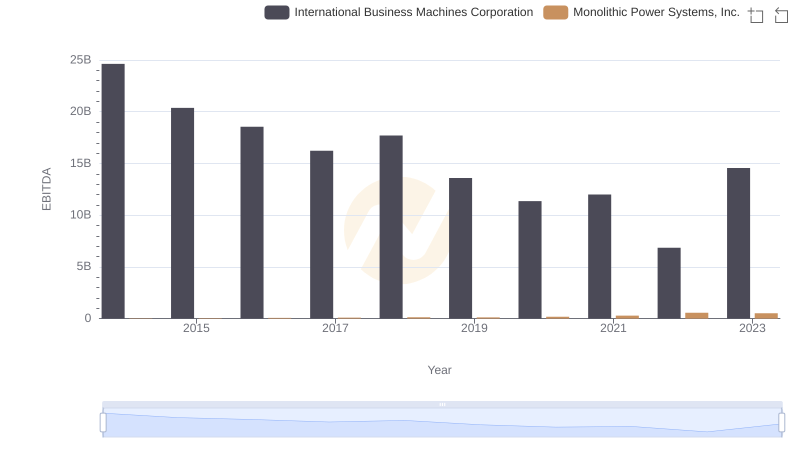
EBITDA Performance Review: International Business Machines Corporation vs Monolithic Power Systems, Inc.
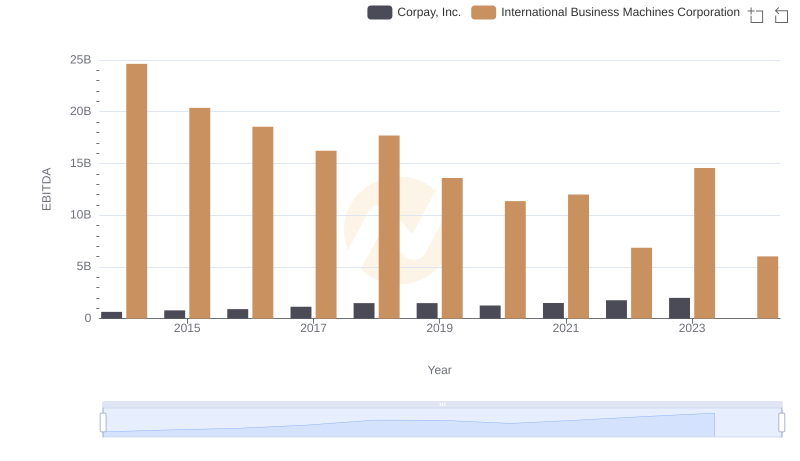
Professional EBITDA Benchmarking: International Business Machines Corporation vs Corpay, Inc.
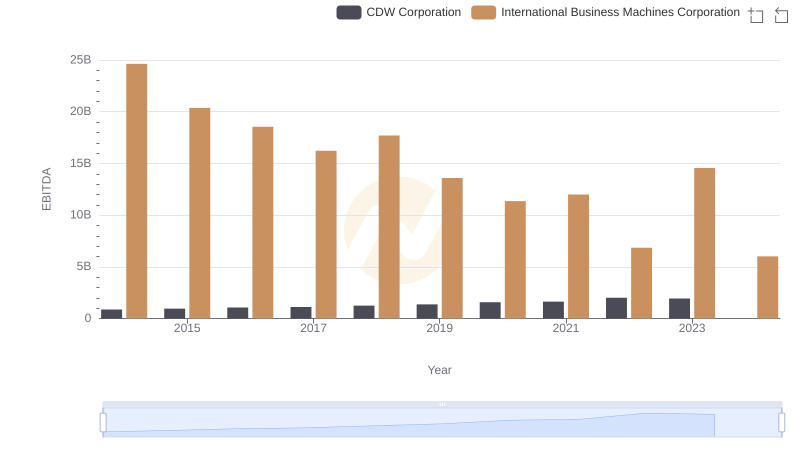
A Side-by-Side Analysis of EBITDA: International Business Machines Corporation and CDW Corporation
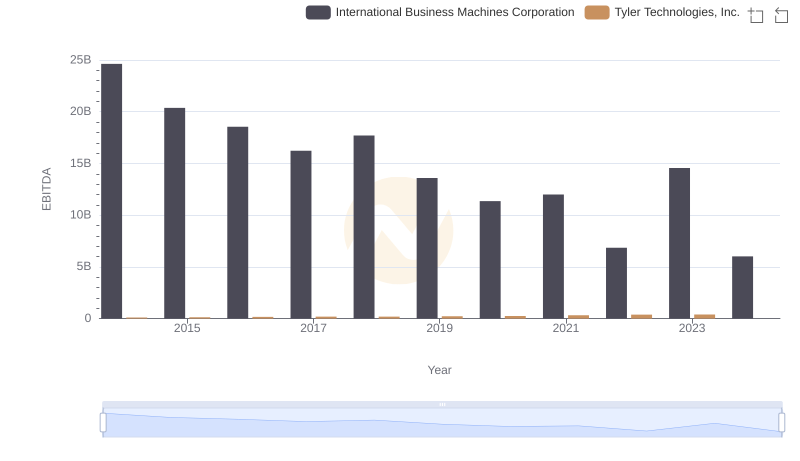
EBITDA Metrics Evaluated: International Business Machines Corporation vs Tyler Technologies, Inc.
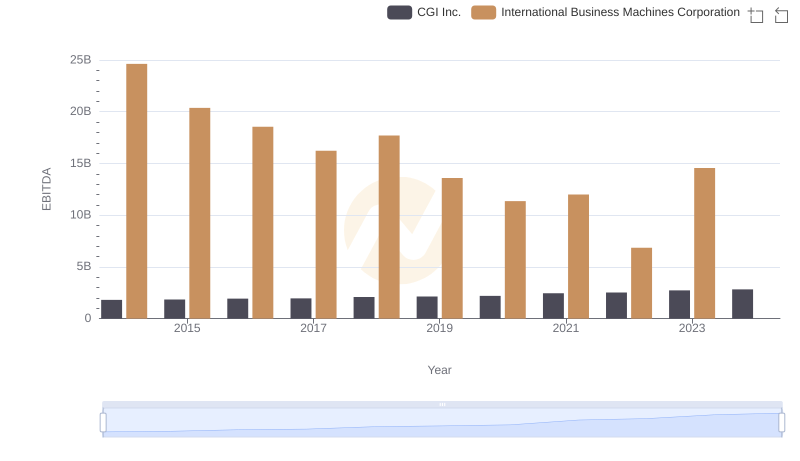
Comprehensive EBITDA Comparison: International Business Machines Corporation vs CGI Inc.