| __timestamp | International Business Machines Corporation | Microchip Technology Incorporated |
|---|---|---|
| Wednesday, January 1, 2014 | 24962000000 | 651027000 |
| Thursday, January 1, 2015 | 20268000000 | 731158000 |
| Friday, January 1, 2016 | 17341000000 | 668482000 |
| Sunday, January 1, 2017 | 16556000000 | 705341000 |
| Monday, January 1, 2018 | 16545000000 | 1552200000 |
| Tuesday, January 1, 2019 | 14609000000 | 1624400000 |
| Wednesday, January 1, 2020 | 10555000000 | 1909400000 |
| Friday, January 1, 2021 | 12409000000 | 2153100000 |
| Saturday, January 1, 2022 | 7174000000 | 3022600000 |
| Sunday, January 1, 2023 | 14693000000 | 4112000000 |
| Monday, January 1, 2024 | 6015000000 | 3438200000 |
Unlocking the unknown
In the ever-evolving landscape of technology, the financial health of companies like International Business Machines Corporation (IBM) and Microchip Technology Incorporated offers a fascinating glimpse into industry dynamics. Over the past decade, IBM's EBITDA has seen a significant decline, dropping from its peak in 2014 to nearly half by 2024. This represents a decrease of approximately 75%, highlighting the challenges faced by the tech giant in adapting to new market demands.
Conversely, Microchip Technology has demonstrated resilience and growth, with its EBITDA increasing by over 500% from 2014 to 2023. This upward trajectory underscores the company's strategic positioning in the semiconductor industry, capitalizing on the growing demand for microcontrollers and integrated circuits.
As we look to the future, these trends provide valuable insights into the shifting priorities and innovations driving the tech sector forward.
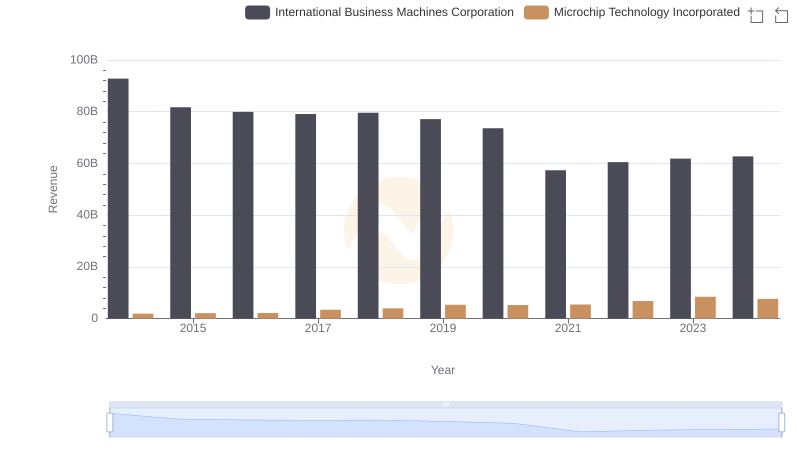
Annual Revenue Comparison: International Business Machines Corporation vs Microchip Technology Incorporated
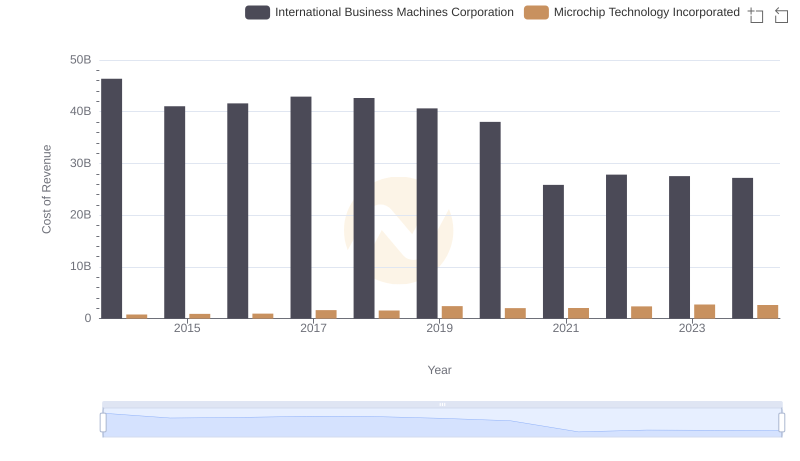
Comparing Cost of Revenue Efficiency: International Business Machines Corporation vs Microchip Technology Incorporated
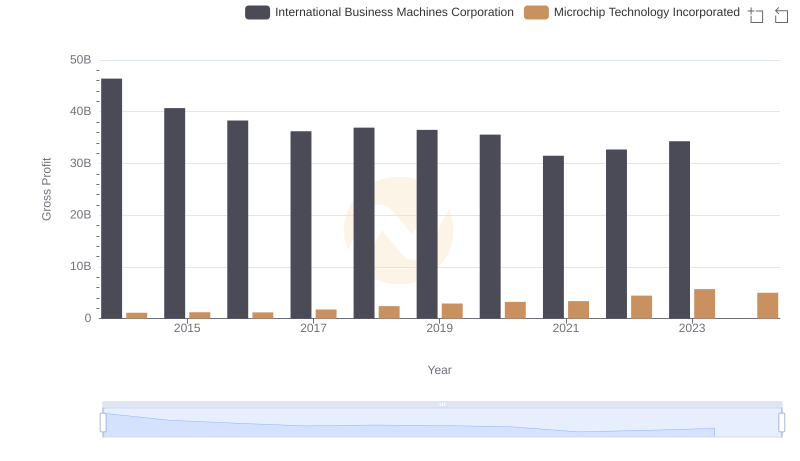
Gross Profit Analysis: Comparing International Business Machines Corporation and Microchip Technology Incorporated
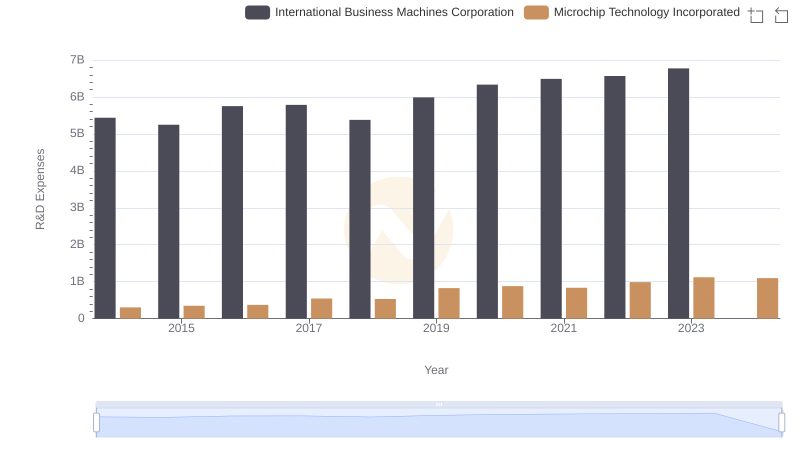
Analyzing R&D Budgets: International Business Machines Corporation vs Microchip Technology Incorporated
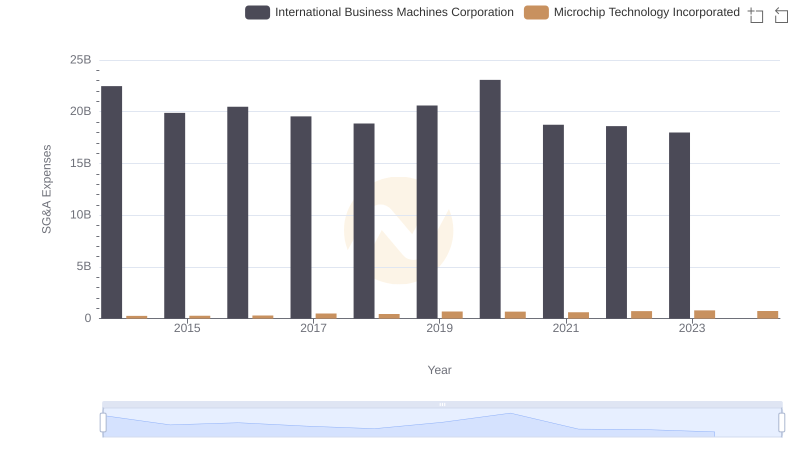
Operational Costs Compared: SG&A Analysis of International Business Machines Corporation and Microchip Technology Incorporated
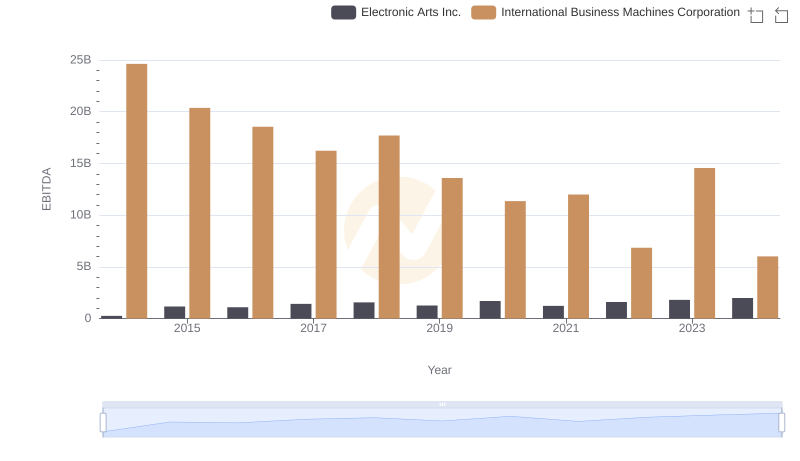
EBITDA Performance Review: International Business Machines Corporation vs Electronic Arts Inc.
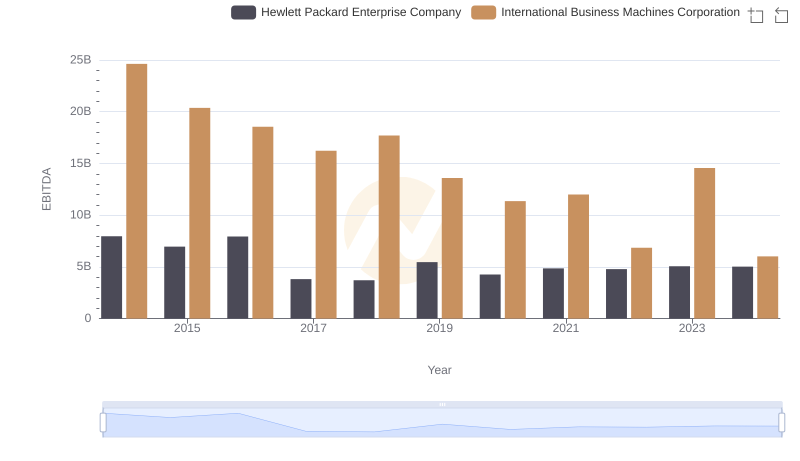
A Side-by-Side Analysis of EBITDA: International Business Machines Corporation and Hewlett Packard Enterprise Company
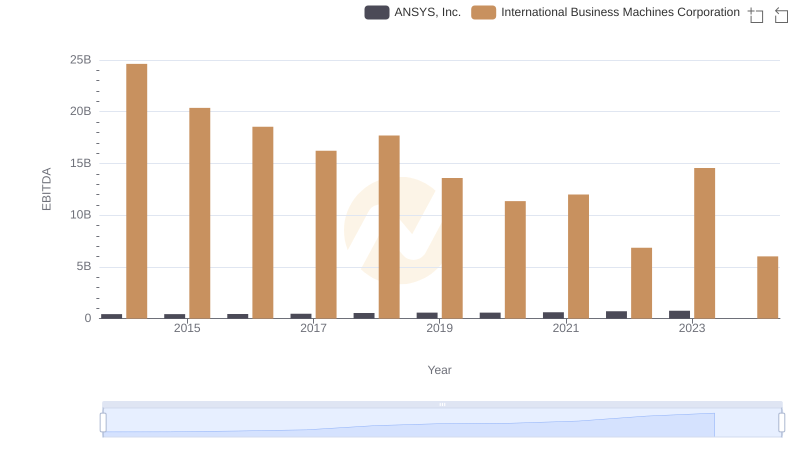
Comparative EBITDA Analysis: International Business Machines Corporation vs ANSYS, Inc.
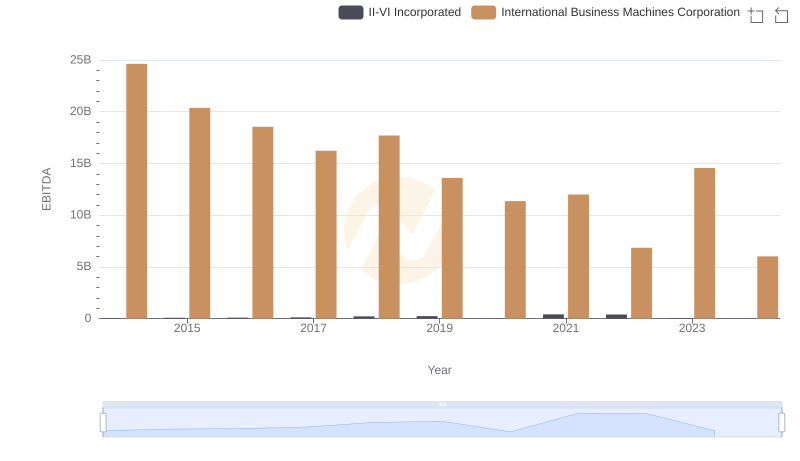
A Professional Review of EBITDA: International Business Machines Corporation Compared to II-VI Incorporated
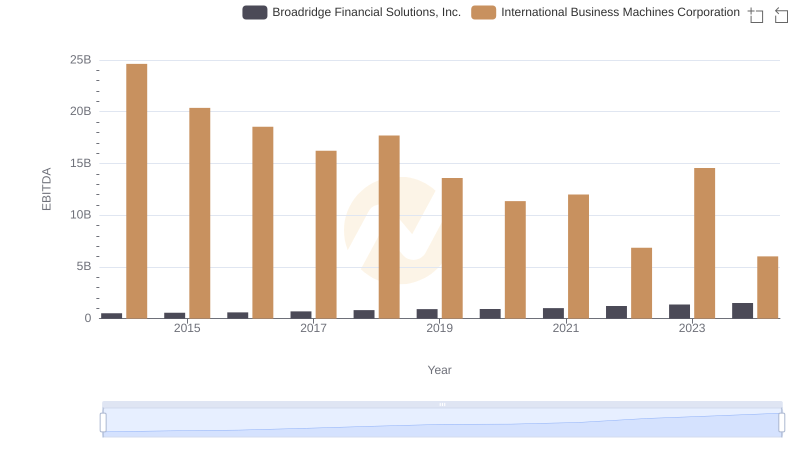
International Business Machines Corporation and Broadridge Financial Solutions, Inc.: A Detailed Examination of EBITDA Performance
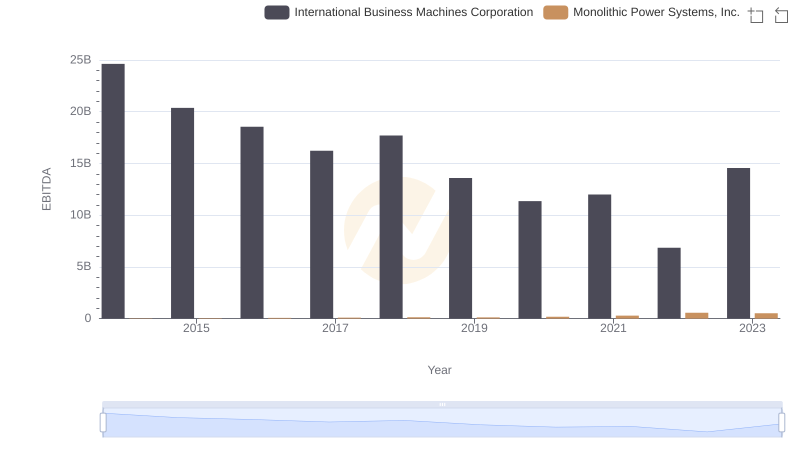
EBITDA Performance Review: International Business Machines Corporation vs Monolithic Power Systems, Inc.
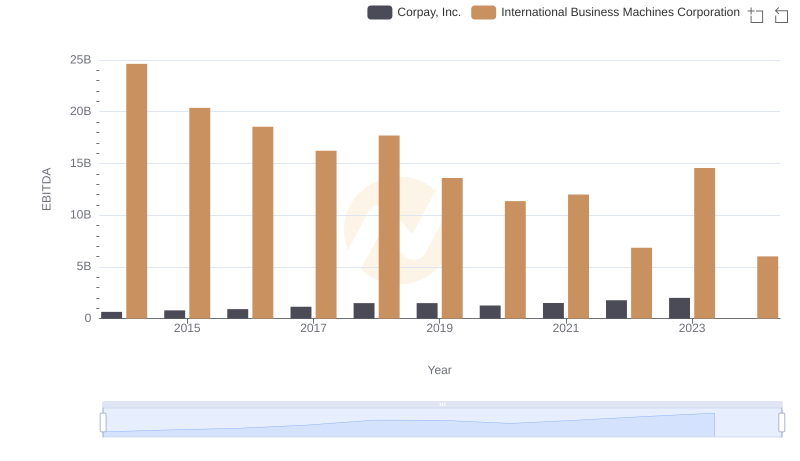
Professional EBITDA Benchmarking: International Business Machines Corporation vs Corpay, Inc.