| __timestamp | CGI Inc. | International Business Machines Corporation |
|---|---|---|
| Wednesday, January 1, 2014 | 8263306000 | 46386000000 |
| Thursday, January 1, 2015 | 7980185000 | 41057000000 |
| Friday, January 1, 2016 | 8293407000 | 41403000000 |
| Sunday, January 1, 2017 | 8500825000 | 42196000000 |
| Monday, January 1, 2018 | 9045660000 | 42655000000 |
| Tuesday, January 1, 2019 | 9471661000 | 26181000000 |
| Wednesday, January 1, 2020 | 9420400000 | 24314000000 |
| Friday, January 1, 2021 | 9409971000 | 25865000000 |
| Saturday, January 1, 2022 | 10048149000 | 27842000000 |
| Sunday, January 1, 2023 | 11982421000 | 27560000000 |
| Monday, January 1, 2024 | 12259730000 | 27202000000 |
Unleashing the power of data
In the ever-evolving landscape of technology, International Business Machines Corporation (IBM) and CGI Inc. have been pivotal players. Over the past decade, from 2014 to 2024, these companies have showcased contrasting trends in their cost of revenue. IBM, a stalwart in the tech industry, has seen a significant decline of approximately 41% in its cost of revenue, dropping from 46 billion to 27 billion. This reduction reflects IBM's strategic shift towards more efficient operations and a focus on high-margin services.
Conversely, CGI Inc., a leader in IT and business consulting, has experienced a steady increase of about 48% in its cost of revenue, rising from 8 billion to 12 billion. This growth underscores CGI's expansion and investment in new markets and technologies. As these two giants continue to adapt, their financial strategies offer a fascinating glimpse into the future of the tech industry.

Analyzing Cost of Revenue: International Business Machines Corporation and Broadridge Financial Solutions, Inc.
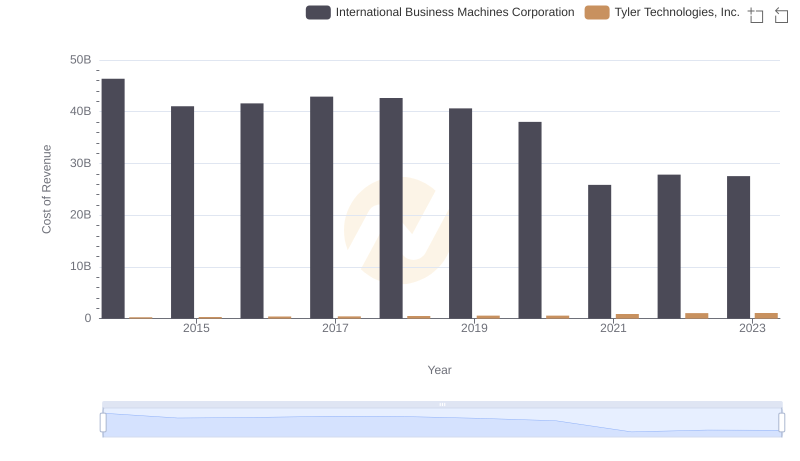
Cost of Revenue: Key Insights for International Business Machines Corporation and Tyler Technologies, Inc.
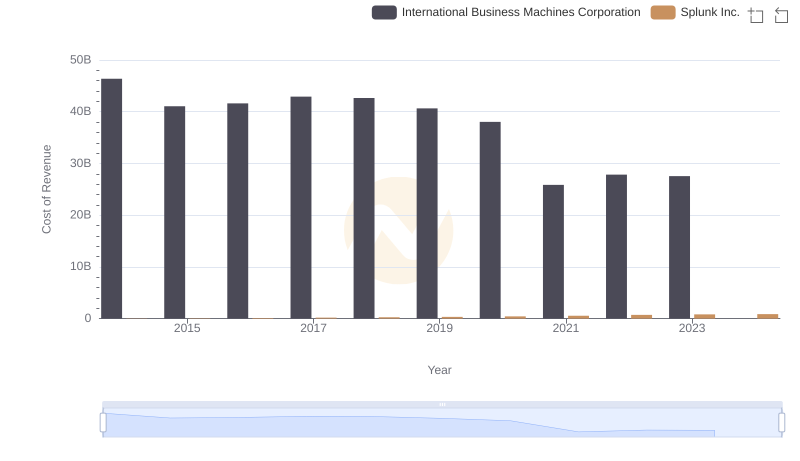
Cost of Revenue Comparison: International Business Machines Corporation vs Splunk Inc.
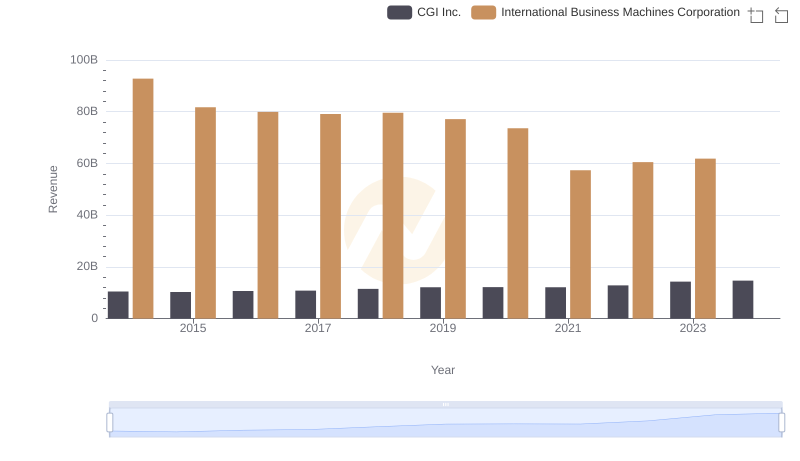
Revenue Insights: International Business Machines Corporation and CGI Inc. Performance Compared
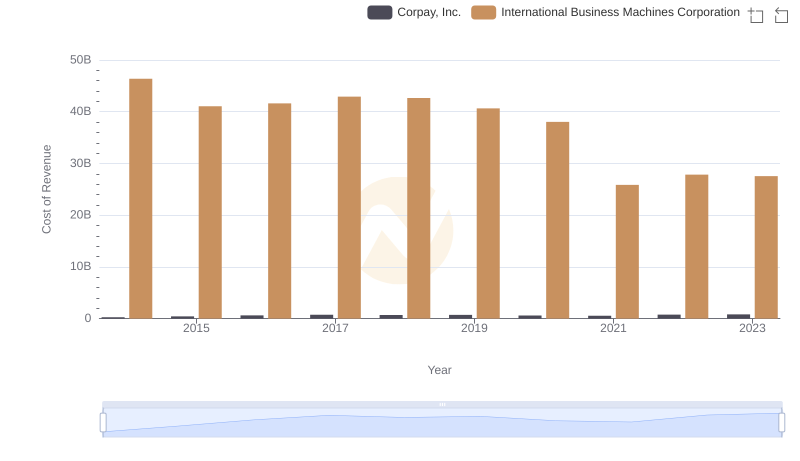
Analyzing Cost of Revenue: International Business Machines Corporation and Corpay, Inc.
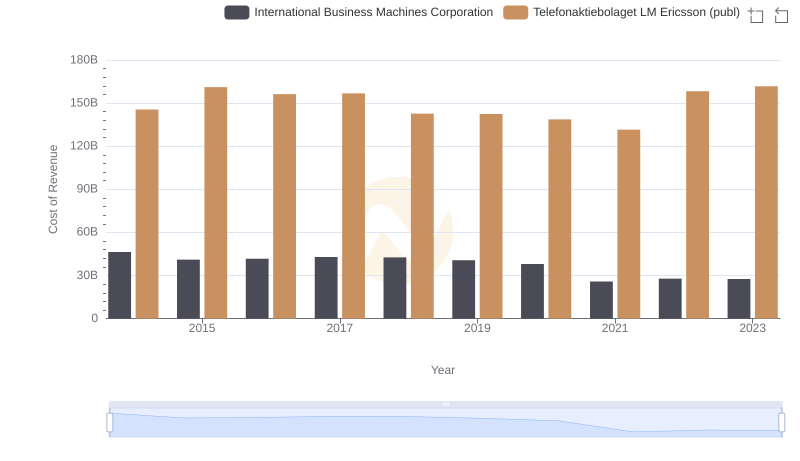
Cost of Revenue Trends: International Business Machines Corporation vs Telefonaktiebolaget LM Ericsson (publ)
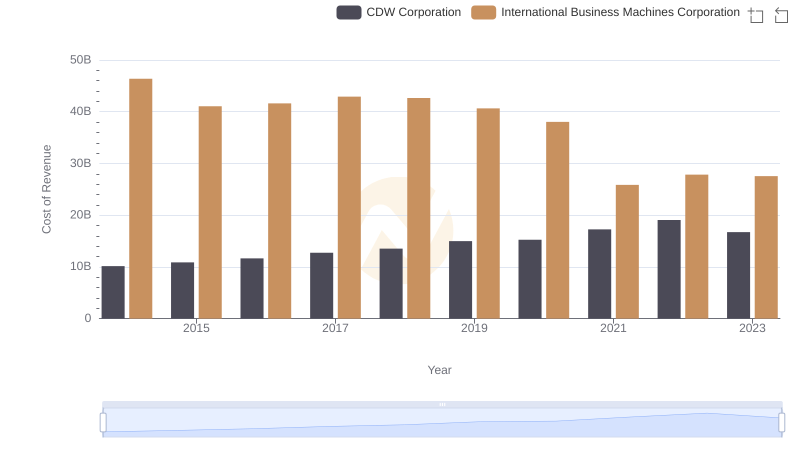
Analyzing Cost of Revenue: International Business Machines Corporation and CDW Corporation
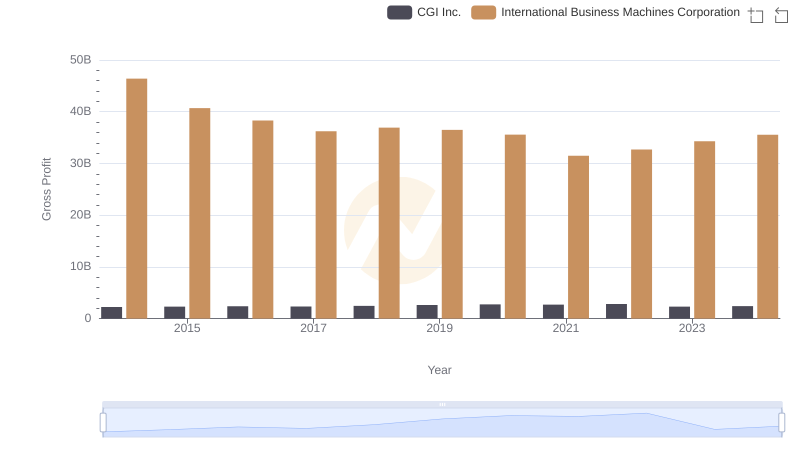
International Business Machines Corporation and CGI Inc.: A Detailed Gross Profit Analysis
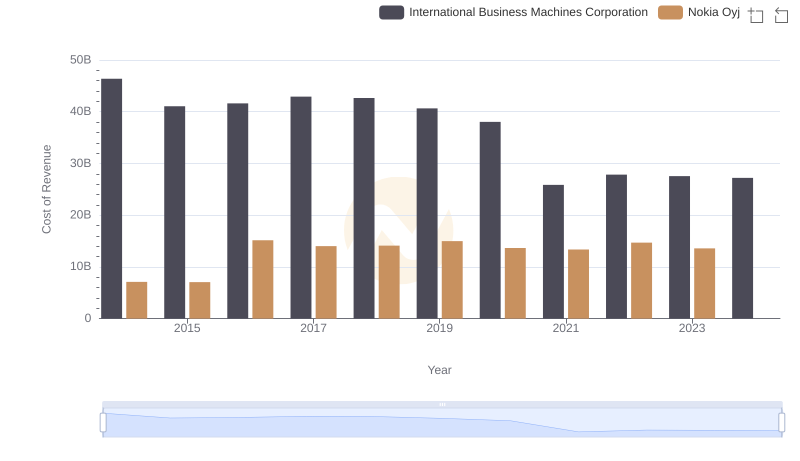
Analyzing Cost of Revenue: International Business Machines Corporation and Nokia Oyj
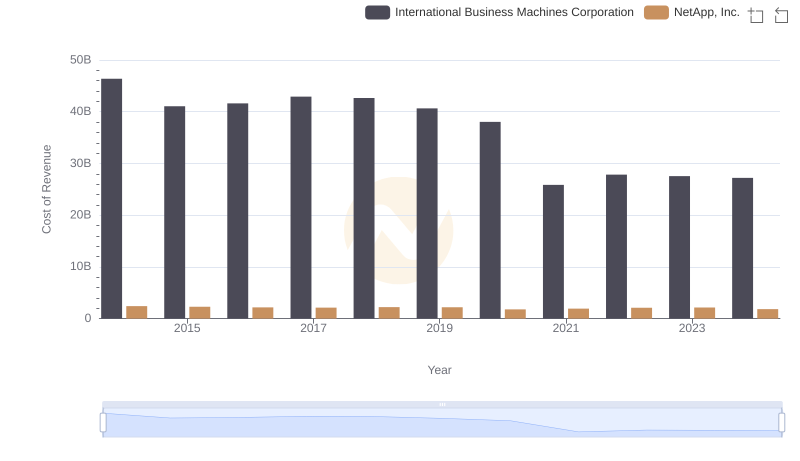
Analyzing Cost of Revenue: International Business Machines Corporation and NetApp, Inc.
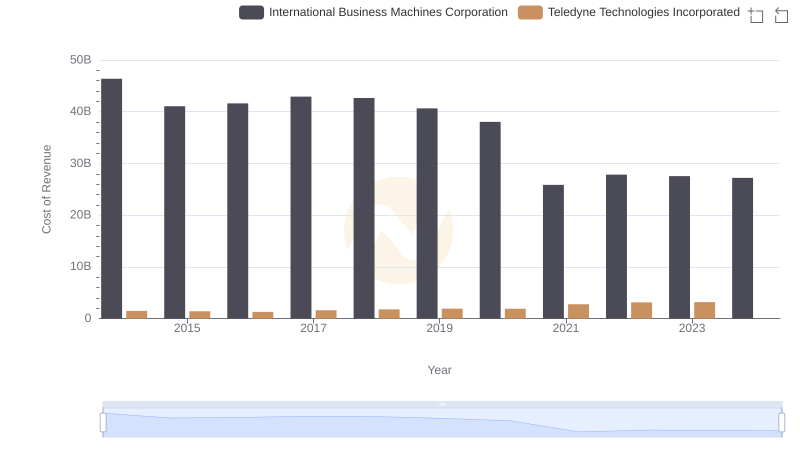
Cost Insights: Breaking Down International Business Machines Corporation and Teledyne Technologies Incorporated's Expenses
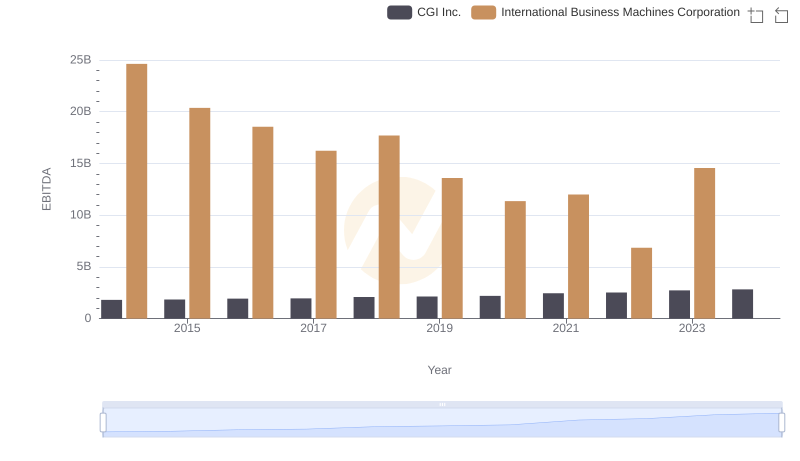
Comprehensive EBITDA Comparison: International Business Machines Corporation vs CGI Inc.