| __timestamp | International Business Machines Corporation | Tyler Technologies, Inc. |
|---|---|---|
| Wednesday, January 1, 2014 | 24962000000 | 109427000 |
| Thursday, January 1, 2015 | 20268000000 | 127617000 |
| Friday, January 1, 2016 | 17341000000 | 165194000 |
| Sunday, January 1, 2017 | 16556000000 | 194467000 |
| Monday, January 1, 2018 | 16545000000 | 191279000 |
| Tuesday, January 1, 2019 | 14609000000 | 233039000 |
| Wednesday, January 1, 2020 | 10555000000 | 254583000 |
| Friday, January 1, 2021 | 12409000000 | 328119000 |
| Saturday, January 1, 2022 | 7174000000 | 388013000 |
| Sunday, January 1, 2023 | 14693000000 | 392632000 |
| Monday, January 1, 2024 | 6015000000 | 299526000 |
Cracking the code
In the ever-evolving landscape of technology, International Business Machines Corporation (IBM) and Tyler Technologies, Inc. present a fascinating study in contrasts. Over the past decade, IBM's EBITDA has seen a rollercoaster ride, peaking in 2014 and 2015 before experiencing a significant dip in 2022. Despite this, IBM's EBITDA in 2023 rebounded to approximately 14.6 billion, showcasing its resilience.
On the other hand, Tyler Technologies, a leader in public sector software, has shown consistent growth. From 2014 to 2023, Tyler's EBITDA increased by over 250%, reflecting its strategic focus on niche markets. However, data for 2024 is missing, leaving a gap in the narrative.
This comparison highlights the diverse strategies and market dynamics that shape the financial trajectories of tech giants and niche players alike.
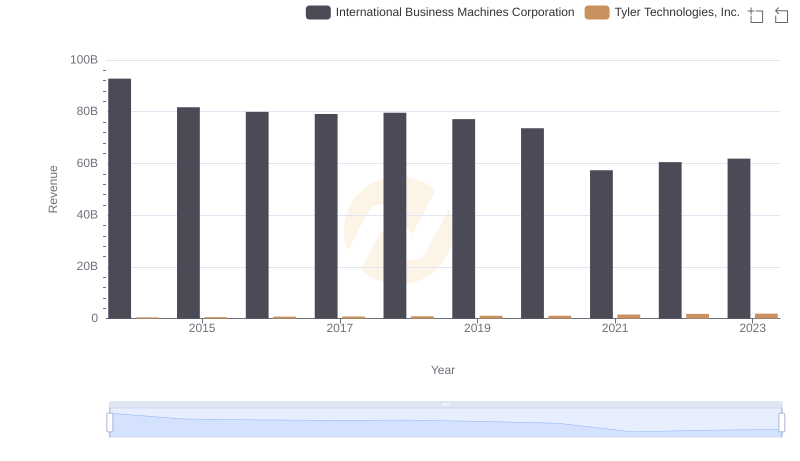
International Business Machines Corporation vs Tyler Technologies, Inc.: Examining Key Revenue Metrics
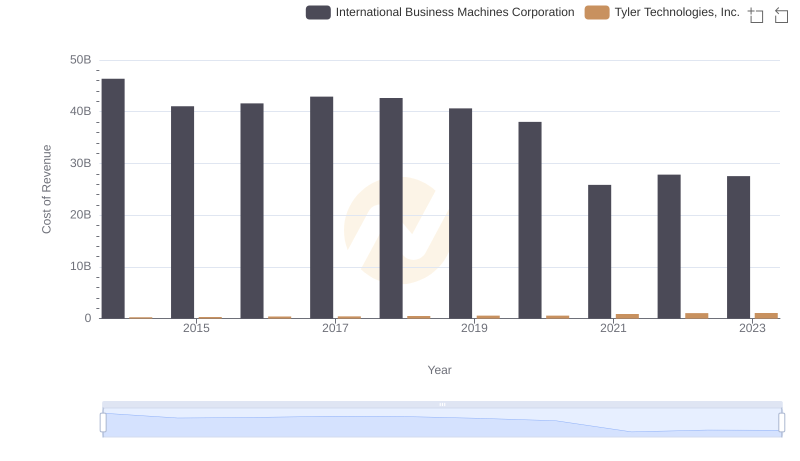
Cost of Revenue: Key Insights for International Business Machines Corporation and Tyler Technologies, Inc.
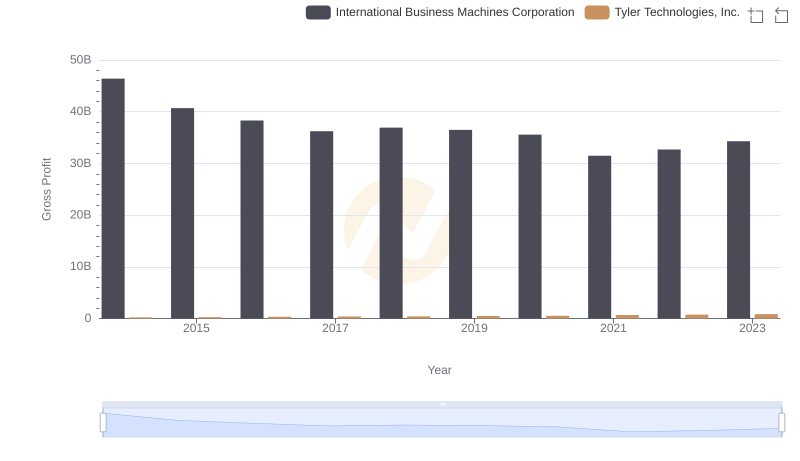
Gross Profit Analysis: Comparing International Business Machines Corporation and Tyler Technologies, Inc.
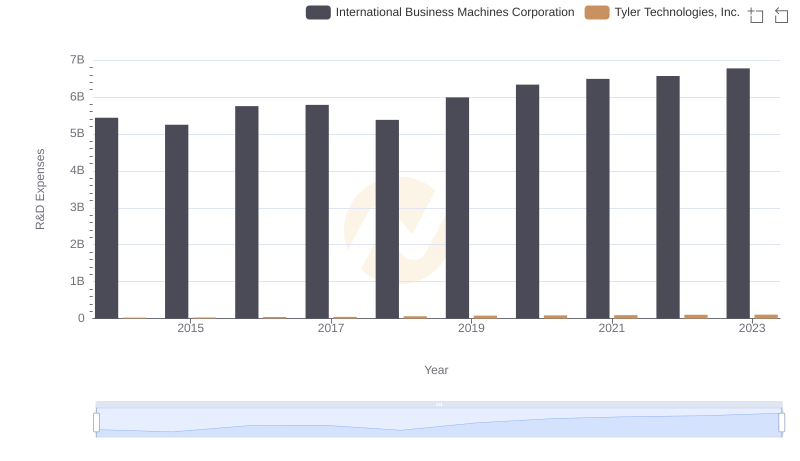
Research and Development Investment: International Business Machines Corporation vs Tyler Technologies, Inc.
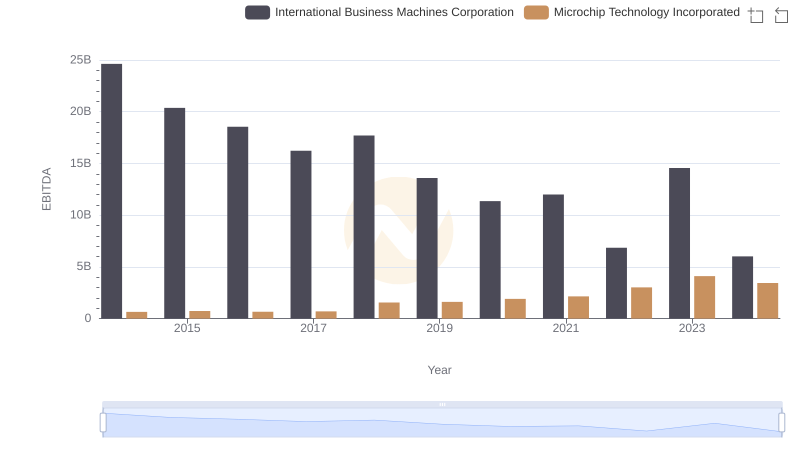
EBITDA Metrics Evaluated: International Business Machines Corporation vs Microchip Technology Incorporated
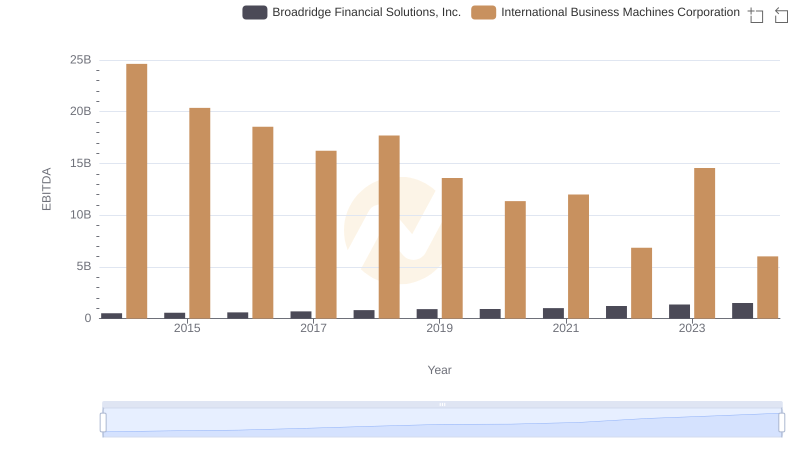
International Business Machines Corporation and Broadridge Financial Solutions, Inc.: A Detailed Examination of EBITDA Performance
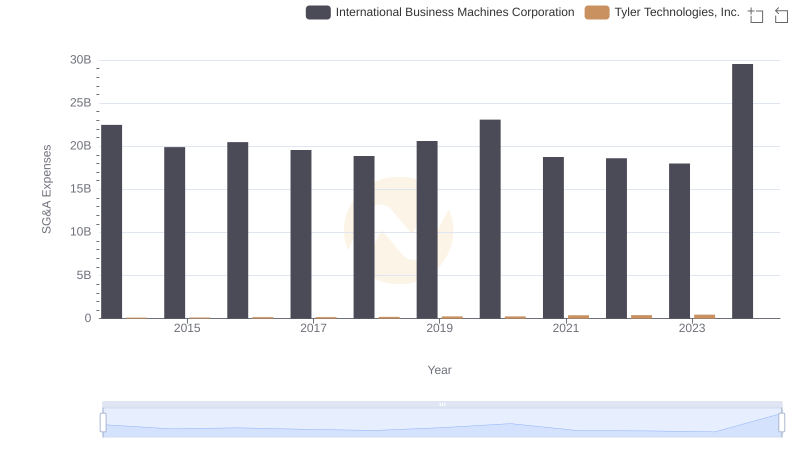
Comparing SG&A Expenses: International Business Machines Corporation vs Tyler Technologies, Inc. Trends and Insights
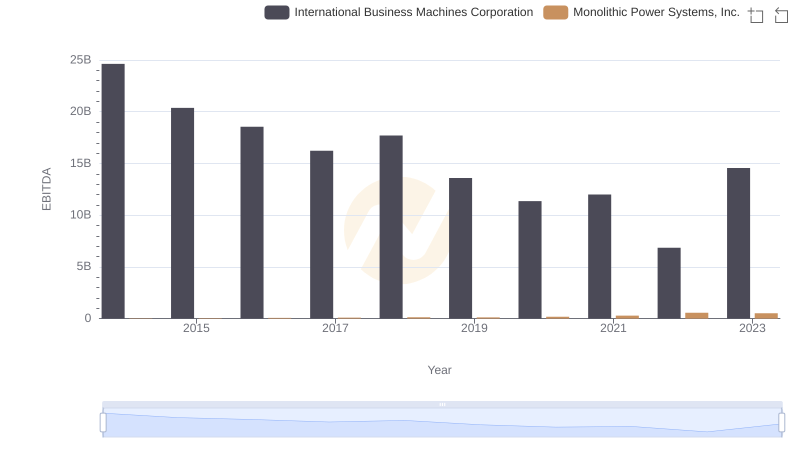
EBITDA Performance Review: International Business Machines Corporation vs Monolithic Power Systems, Inc.
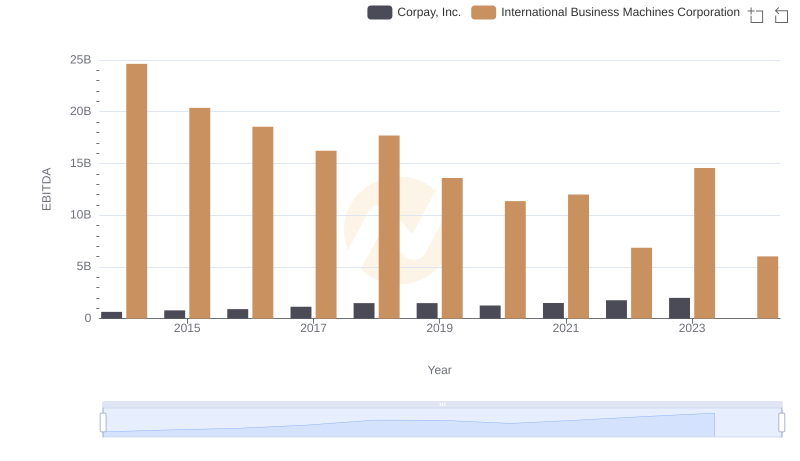
Professional EBITDA Benchmarking: International Business Machines Corporation vs Corpay, Inc.
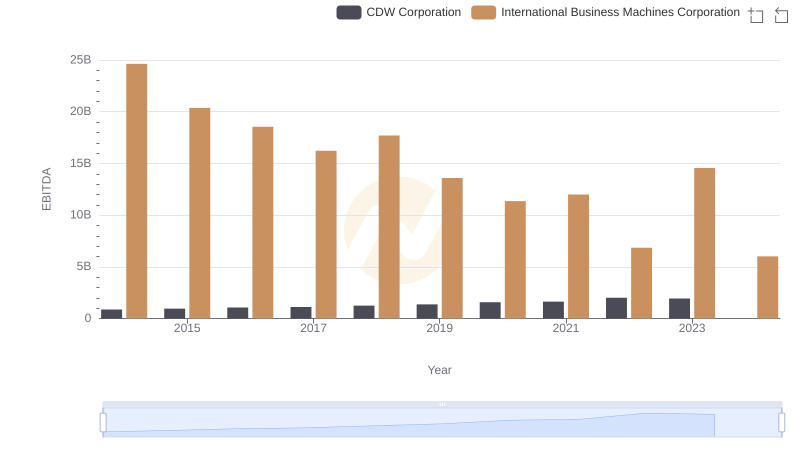
A Side-by-Side Analysis of EBITDA: International Business Machines Corporation and CDW Corporation
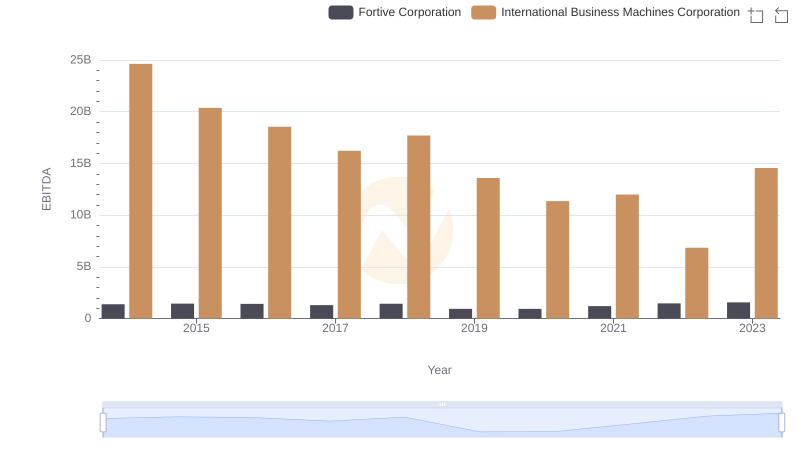
Professional EBITDA Benchmarking: International Business Machines Corporation vs Fortive Corporation
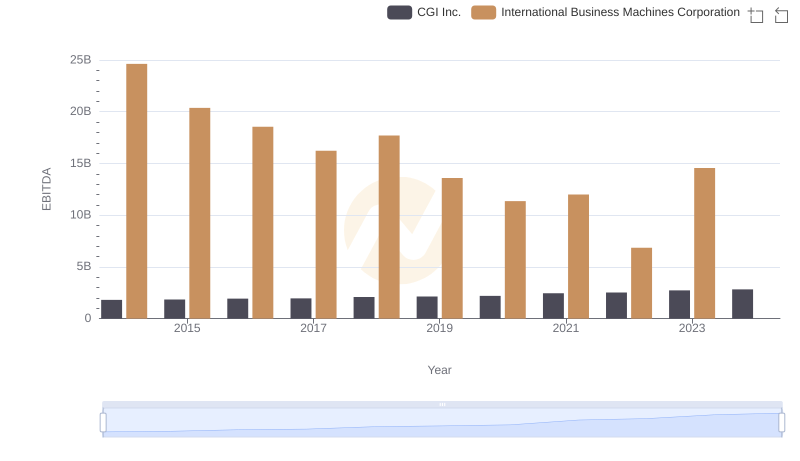
Comprehensive EBITDA Comparison: International Business Machines Corporation vs CGI Inc.