| __timestamp | Corpay, Inc. | International Business Machines Corporation |
|---|---|---|
| Wednesday, January 1, 2014 | 654160000 | 24962000000 |
| Thursday, January 1, 2015 | 797545000 | 20268000000 |
| Friday, January 1, 2016 | 912906000 | 17341000000 |
| Sunday, January 1, 2017 | 1142269000 | 16556000000 |
| Monday, January 1, 2018 | 1502885000 | 16545000000 |
| Tuesday, January 1, 2019 | 1491751000 | 14609000000 |
| Wednesday, January 1, 2020 | 1267130000 | 10555000000 |
| Friday, January 1, 2021 | 1506710000 | 12409000000 |
| Saturday, January 1, 2022 | 1770532000 | 7174000000 |
| Sunday, January 1, 2023 | 2008995000 | 14693000000 |
| Monday, January 1, 2024 | 2119258000 | 6015000000 |
Igniting the spark of knowledge
In the ever-evolving landscape of global business, understanding the financial health of industry giants is crucial. This analysis delves into the EBITDA performance of International Business Machines Corporation (IBM) and Corpay, Inc. over the past decade. From 2014 to 2023, IBM consistently outperformed Corpay, with EBITDA figures peaking at approximately $24.6 billion in 2014. However, IBM's EBITDA saw a decline of around 41% by 2022, reflecting broader industry challenges and strategic shifts.
Corpay, on the other hand, demonstrated a robust growth trajectory, with its EBITDA increasing by over 200% from 2014 to 2023. This growth underscores Corpay's strategic positioning and adaptability in a competitive market. Notably, 2024 data for Corpay is missing, indicating potential reporting delays or strategic changes. This comparative analysis highlights the dynamic nature of corporate financial performance and the importance of strategic agility.
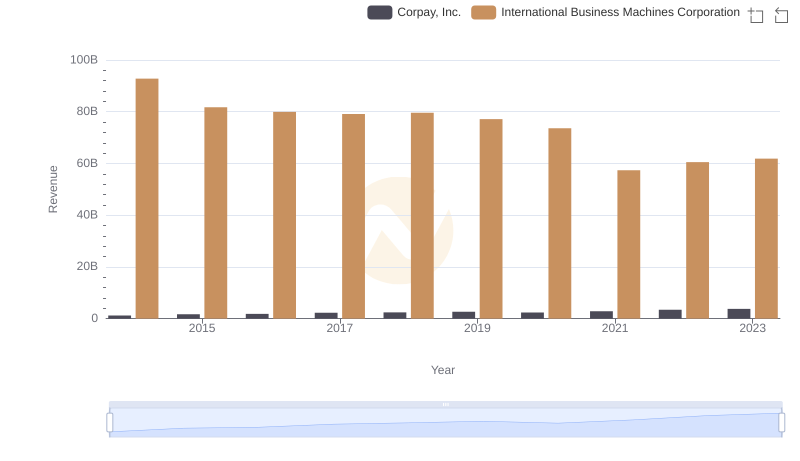
Comparing Revenue Performance: International Business Machines Corporation or Corpay, Inc.?
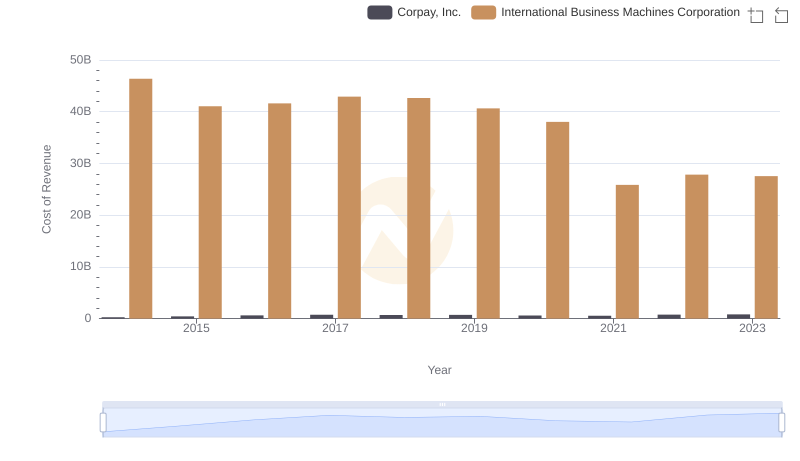
Analyzing Cost of Revenue: International Business Machines Corporation and Corpay, Inc.
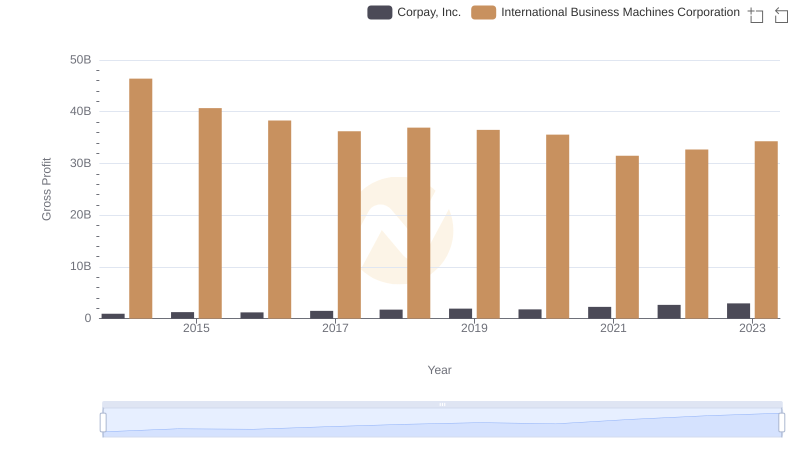
Who Generates Higher Gross Profit? International Business Machines Corporation or Corpay, Inc.
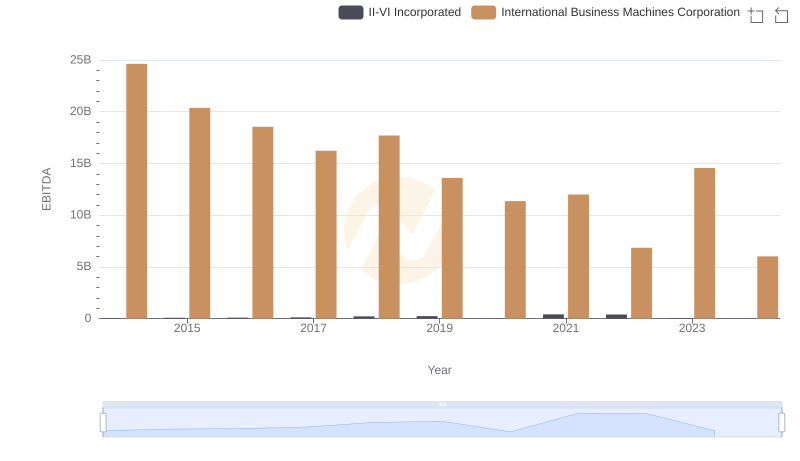
A Professional Review of EBITDA: International Business Machines Corporation Compared to II-VI Incorporated
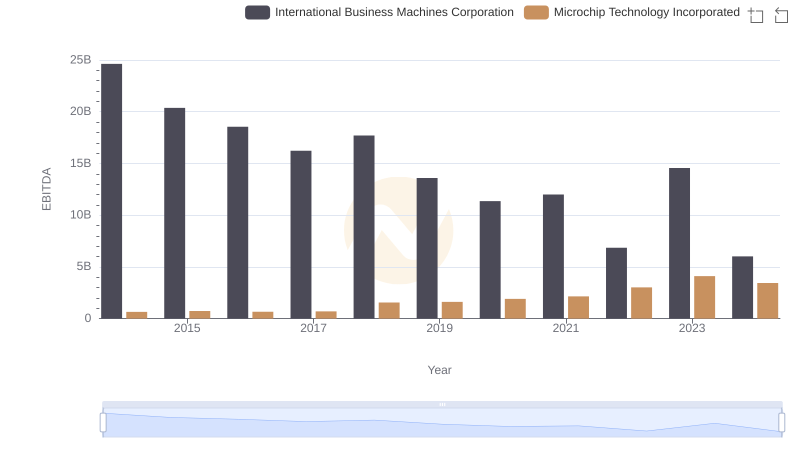
EBITDA Metrics Evaluated: International Business Machines Corporation vs Microchip Technology Incorporated
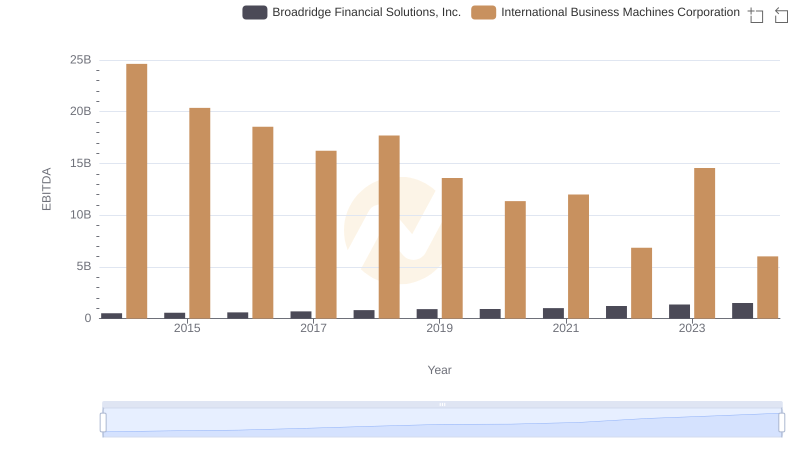
International Business Machines Corporation and Broadridge Financial Solutions, Inc.: A Detailed Examination of EBITDA Performance
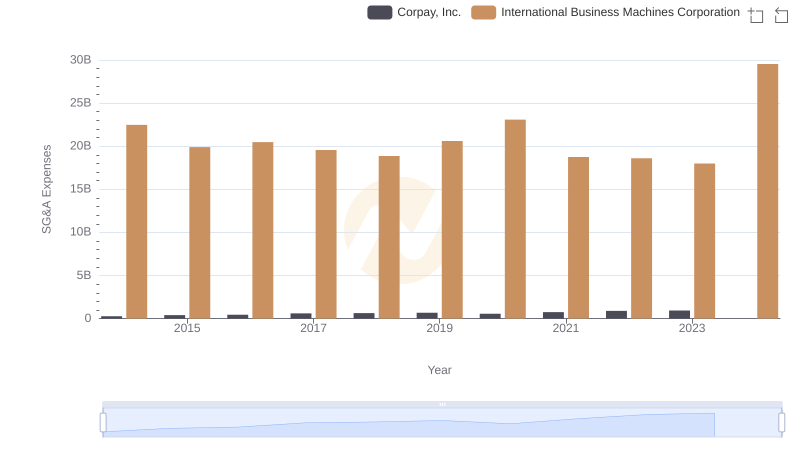
Breaking Down SG&A Expenses: International Business Machines Corporation vs Corpay, Inc.
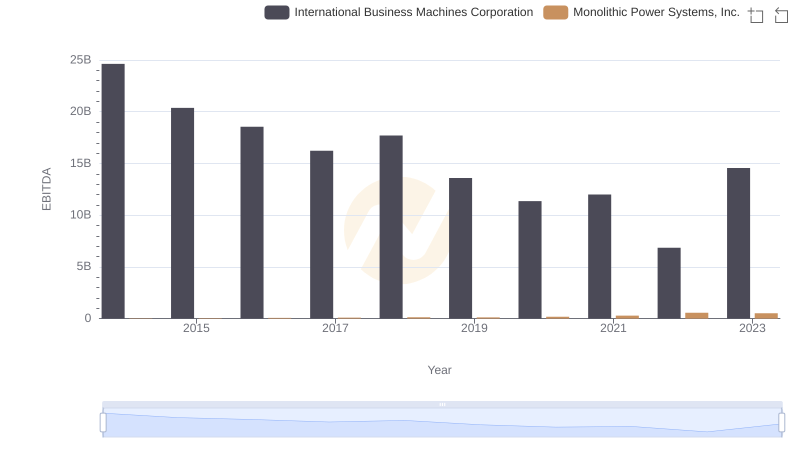
EBITDA Performance Review: International Business Machines Corporation vs Monolithic Power Systems, Inc.
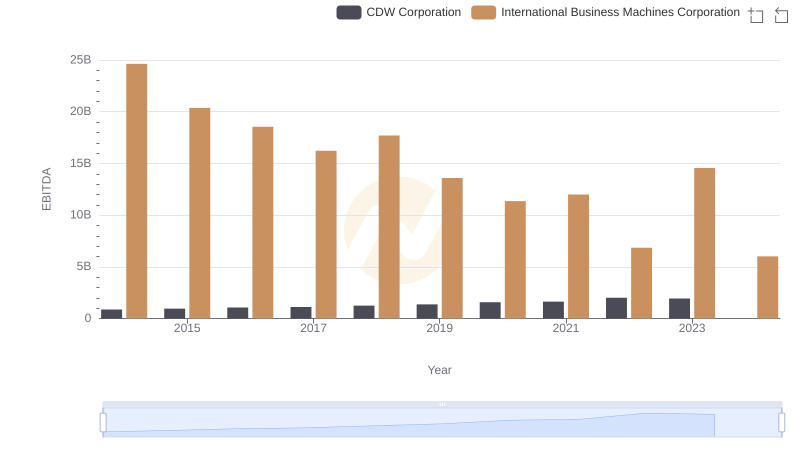
A Side-by-Side Analysis of EBITDA: International Business Machines Corporation and CDW Corporation
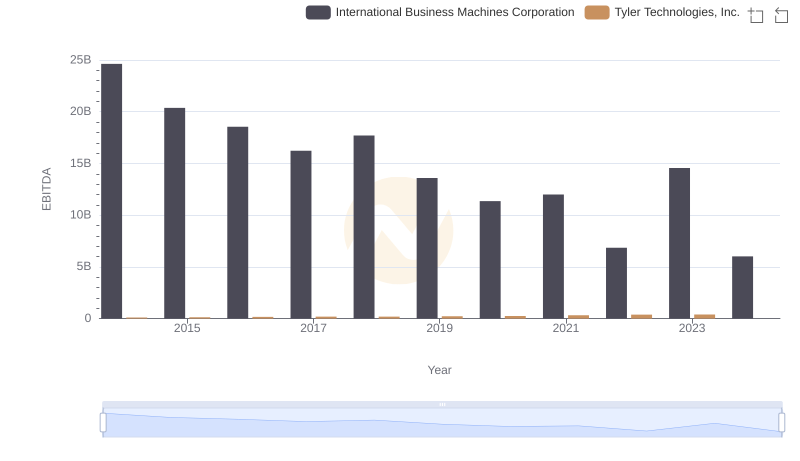
EBITDA Metrics Evaluated: International Business Machines Corporation vs Tyler Technologies, Inc.
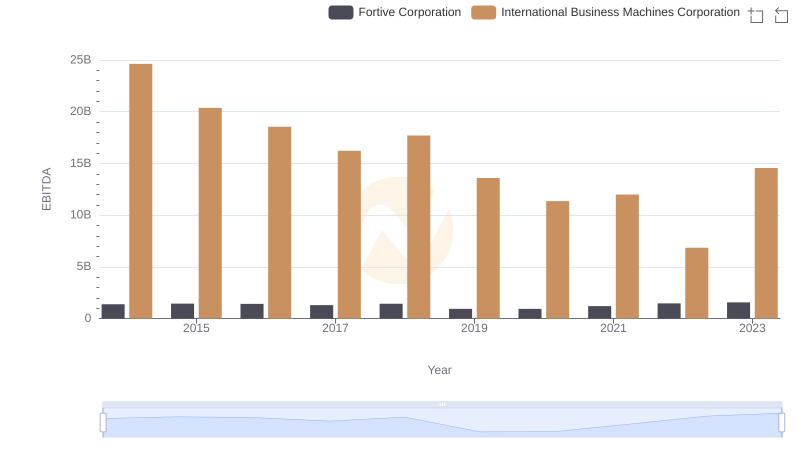
Professional EBITDA Benchmarking: International Business Machines Corporation vs Fortive Corporation
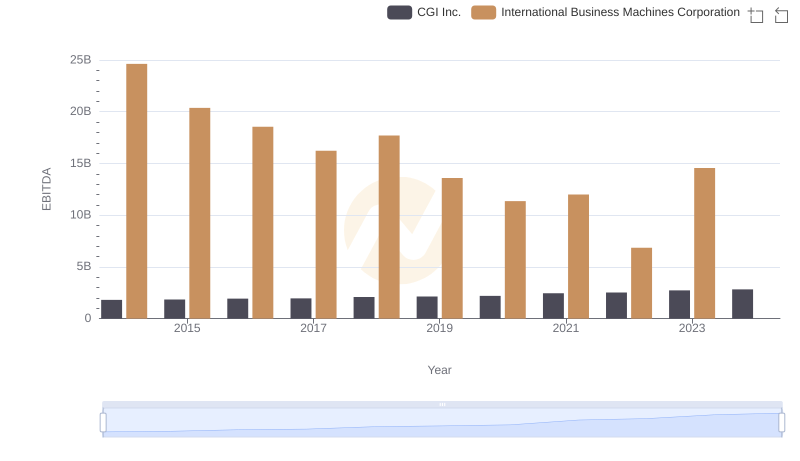
Comprehensive EBITDA Comparison: International Business Machines Corporation vs CGI Inc.