| __timestamp | Broadridge Financial Solutions, Inc. | International Business Machines Corporation |
|---|---|---|
| Wednesday, January 1, 2014 | 515600000 | 24962000000 |
| Thursday, January 1, 2015 | 571200000 | 20268000000 |
| Friday, January 1, 2016 | 608400000 | 17341000000 |
| Sunday, January 1, 2017 | 706000000 | 16556000000 |
| Monday, January 1, 2018 | 815500000 | 16545000000 |
| Tuesday, January 1, 2019 | 912800000 | 14609000000 |
| Wednesday, January 1, 2020 | 924200000 | 10555000000 |
| Friday, January 1, 2021 | 1013300000 | 12409000000 |
| Saturday, January 1, 2022 | 1223900000 | 7174000000 |
| Sunday, January 1, 2023 | 1361400000 | 14693000000 |
| Monday, January 1, 2024 | 1505500000 | 6015000000 |
Data in motion
Over the past decade, the EBITDA performance of International Business Machines Corporation (IBM) and Broadridge Financial Solutions, Inc. has showcased intriguing trends. IBM, a stalwart in the tech industry, experienced a significant decline in EBITDA from 2014 to 2022, dropping by approximately 72%. This decline reflects the challenges faced by traditional tech giants in adapting to the rapidly evolving digital landscape.
In contrast, Broadridge Financial Solutions, a leader in financial technology, demonstrated a robust growth trajectory. From 2014 to 2024, Broadridge's EBITDA surged by nearly 192%, highlighting its successful adaptation to market demands and technological advancements.
The data underscores the shifting dynamics in the tech and financial sectors, where agility and innovation are key to sustaining growth. As we move forward, these trends offer valuable insights into the strategic directions of these industry leaders.
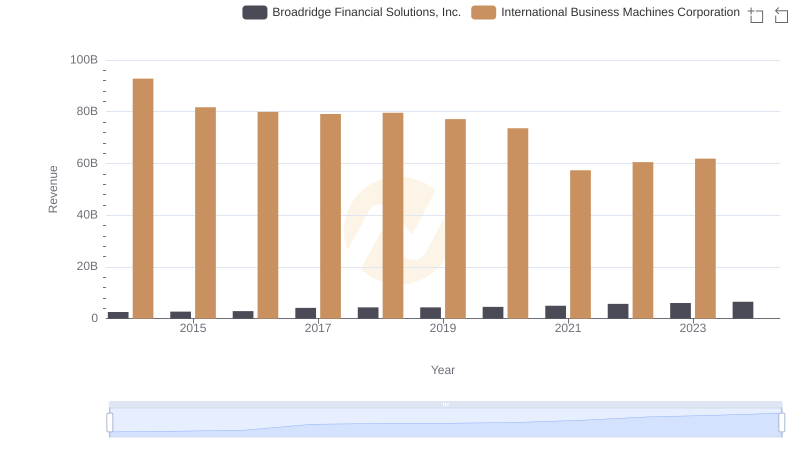
Revenue Insights: International Business Machines Corporation and Broadridge Financial Solutions, Inc. Performance Compared

Analyzing Cost of Revenue: International Business Machines Corporation and Broadridge Financial Solutions, Inc.
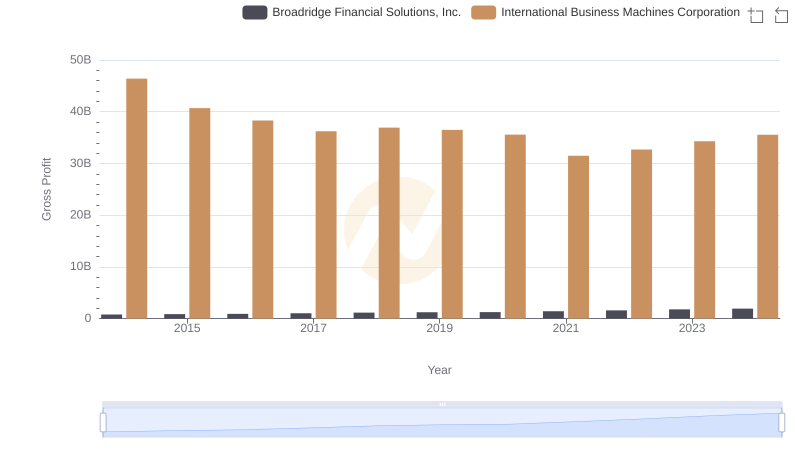
Gross Profit Trends Compared: International Business Machines Corporation vs Broadridge Financial Solutions, Inc.
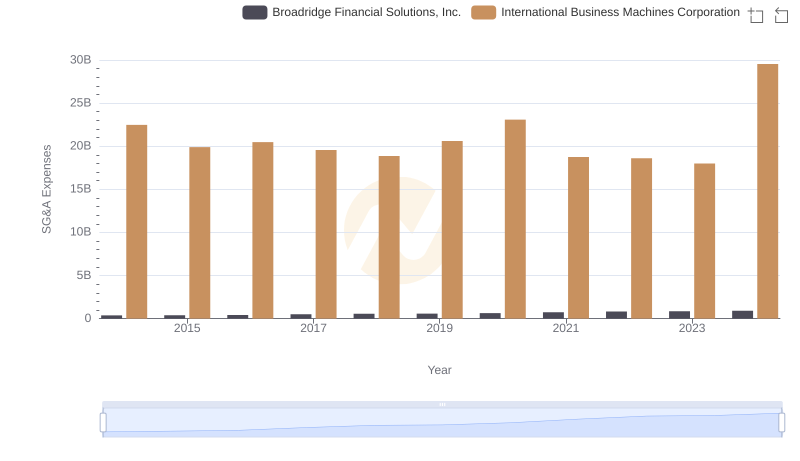
Operational Costs Compared: SG&A Analysis of International Business Machines Corporation and Broadridge Financial Solutions, Inc.
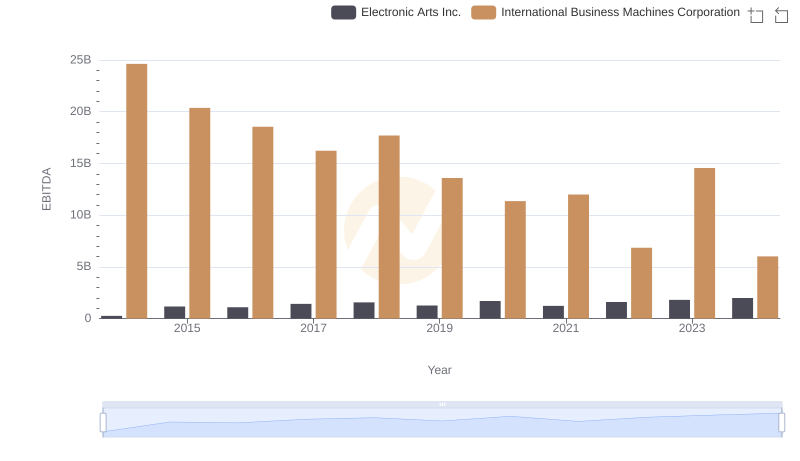
EBITDA Performance Review: International Business Machines Corporation vs Electronic Arts Inc.
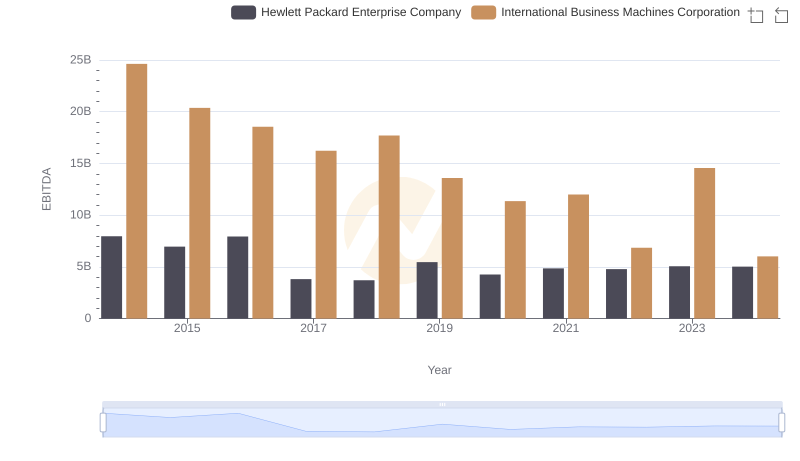
A Side-by-Side Analysis of EBITDA: International Business Machines Corporation and Hewlett Packard Enterprise Company
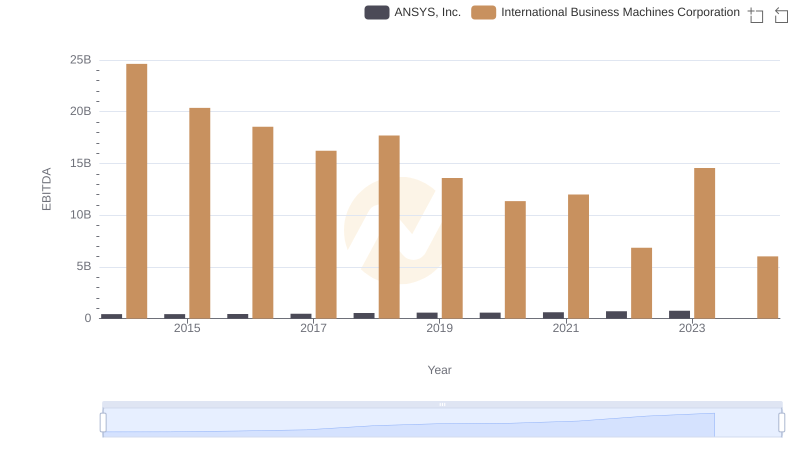
Comparative EBITDA Analysis: International Business Machines Corporation vs ANSYS, Inc.
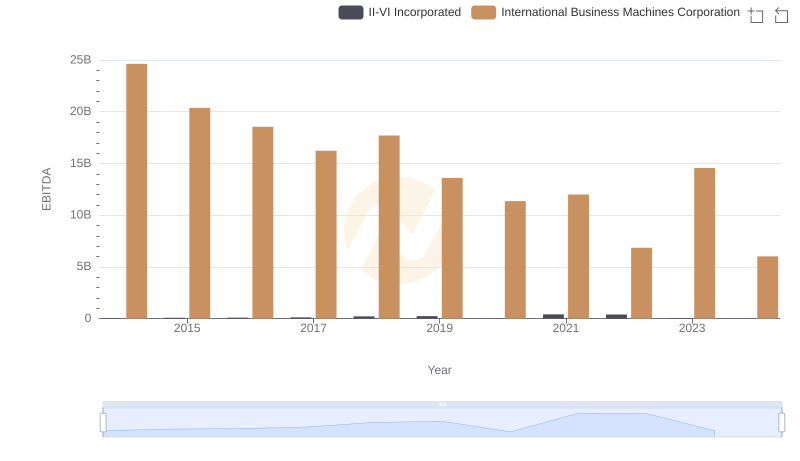
A Professional Review of EBITDA: International Business Machines Corporation Compared to II-VI Incorporated
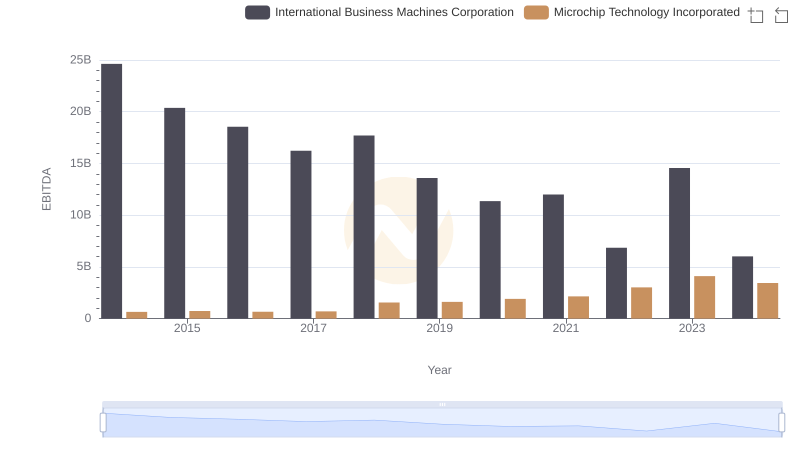
EBITDA Metrics Evaluated: International Business Machines Corporation vs Microchip Technology Incorporated
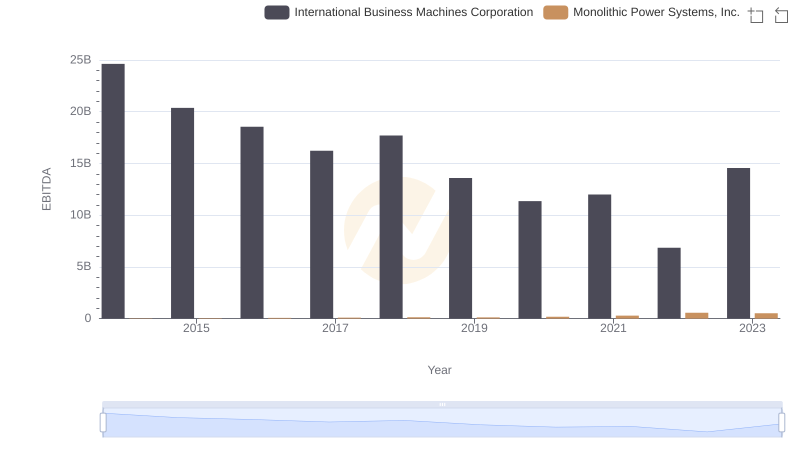
EBITDA Performance Review: International Business Machines Corporation vs Monolithic Power Systems, Inc.
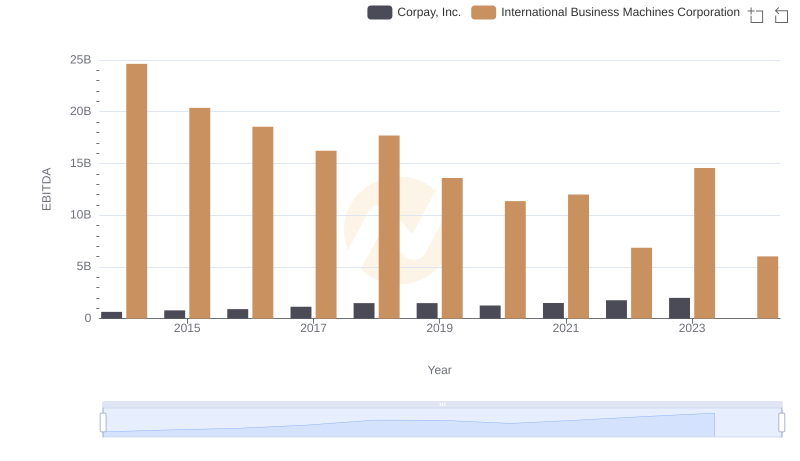
Professional EBITDA Benchmarking: International Business Machines Corporation vs Corpay, Inc.
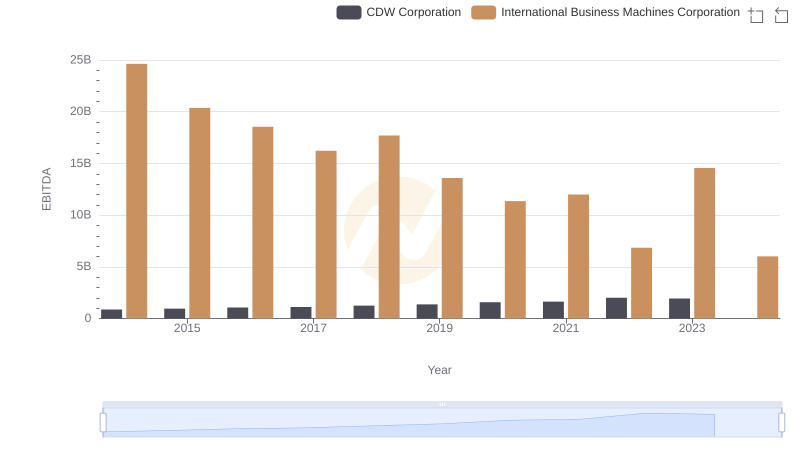
A Side-by-Side Analysis of EBITDA: International Business Machines Corporation and CDW Corporation