| __timestamp | Pentair plc | United Rentals, Inc. |
|---|---|---|
| Wednesday, January 1, 2014 | 4563000000 | 3253000000 |
| Thursday, January 1, 2015 | 4263200000 | 3337000000 |
| Friday, January 1, 2016 | 3095900000 | 3359000000 |
| Sunday, January 1, 2017 | 3107400000 | 3872000000 |
| Monday, January 1, 2018 | 1917400000 | 4683000000 |
| Tuesday, January 1, 2019 | 1905700000 | 5681000000 |
| Wednesday, January 1, 2020 | 1960200000 | 5347000000 |
| Friday, January 1, 2021 | 2445600000 | 5863000000 |
| Saturday, January 1, 2022 | 2757200000 | 6646000000 |
| Sunday, January 1, 2023 | 2585300000 | 8519000000 |
| Monday, January 1, 2024 | 2484000000 | 9195000000 |
In pursuit of knowledge
In the ever-evolving landscape of industrial services and solutions, understanding cost dynamics is crucial. Over the past decade, United Rentals, Inc. and Pentair plc have showcased distinct trajectories in their cost of revenue. From 2014 to 2023, United Rentals, Inc. experienced a robust growth in cost of revenue, surging by approximately 162%, reflecting its aggressive expansion and market penetration strategies. In contrast, Pentair plc's cost of revenue saw a decline of about 43% during the same period, indicating a strategic shift towards efficiency and cost management.
Interestingly, 2023 marked a significant year for United Rentals, Inc., with its cost of revenue peaking at 8.52 billion, while Pentair plc's data for 2024 remains unavailable, hinting at potential strategic pivots. These trends underscore the dynamic nature of the industry and the diverse strategies employed by leading companies to navigate economic challenges.
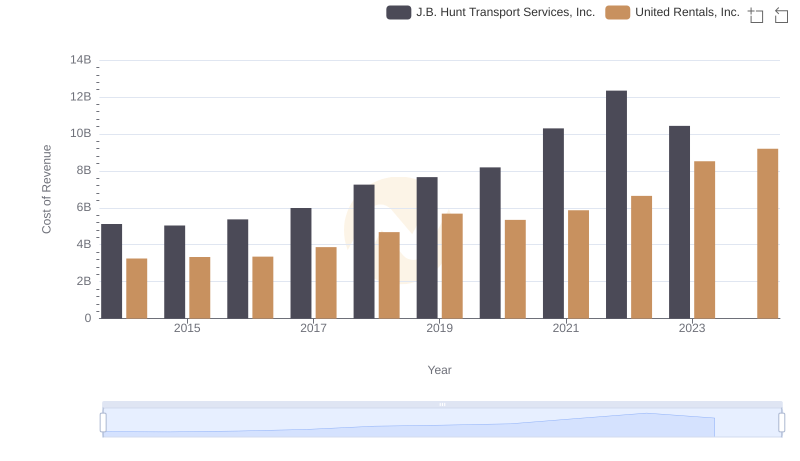
Cost of Revenue Comparison: United Rentals, Inc. vs J.B. Hunt Transport Services, Inc.
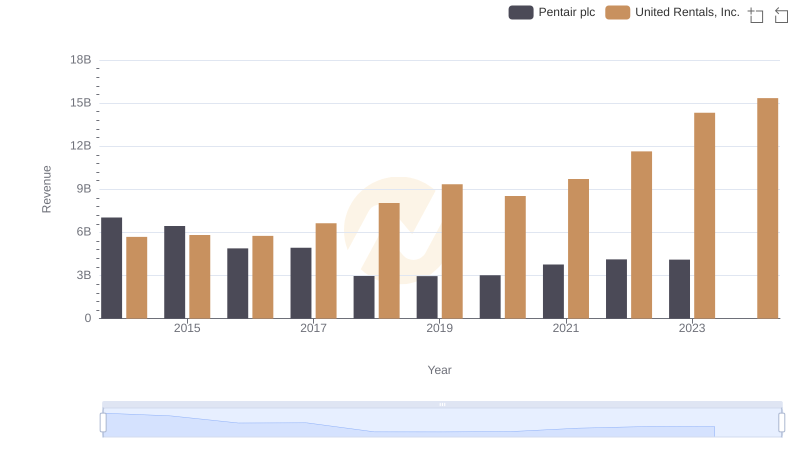
Revenue Showdown: United Rentals, Inc. vs Pentair plc
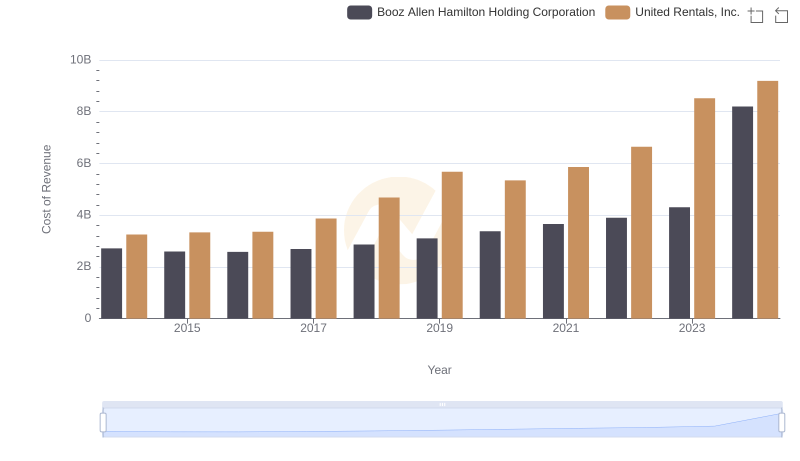
Cost of Revenue: Key Insights for United Rentals, Inc. and Booz Allen Hamilton Holding Corporation
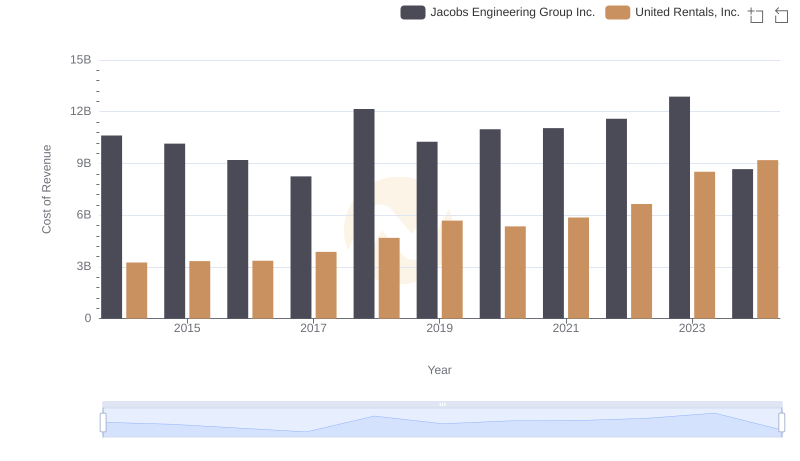
Cost Insights: Breaking Down United Rentals, Inc. and Jacobs Engineering Group Inc.'s Expenses
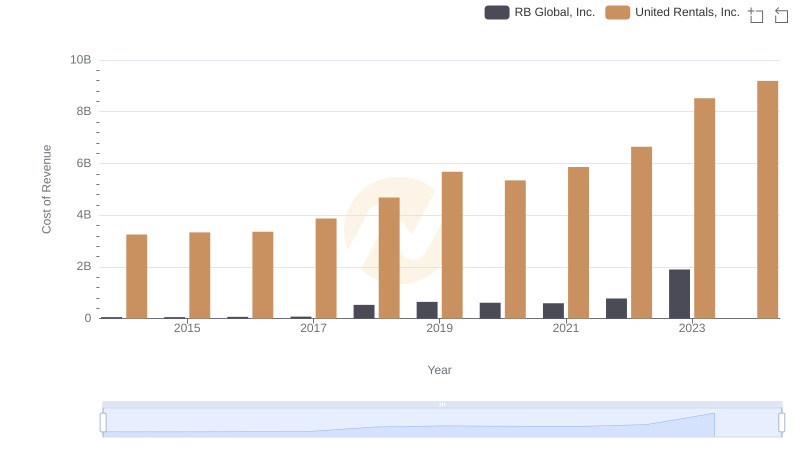
Cost of Revenue Comparison: United Rentals, Inc. vs RB Global, Inc.
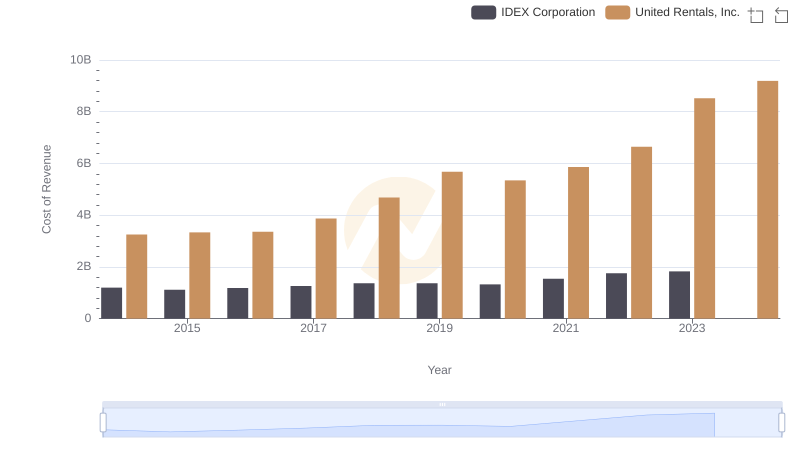
Analyzing Cost of Revenue: United Rentals, Inc. and IDEX Corporation
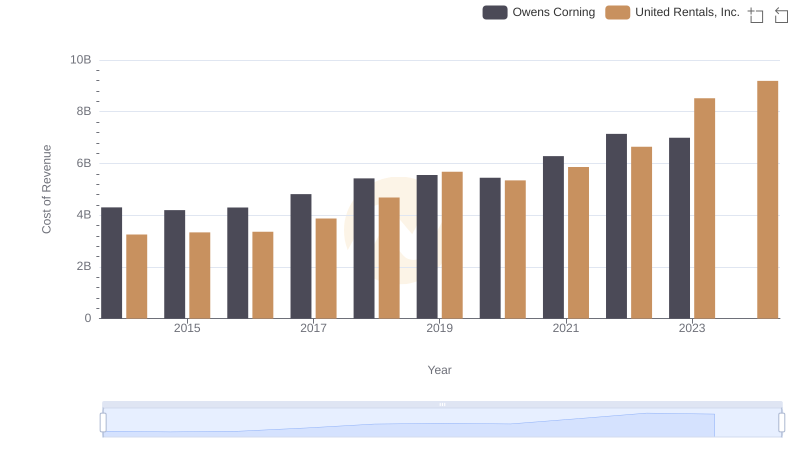
Analyzing Cost of Revenue: United Rentals, Inc. and Owens Corning
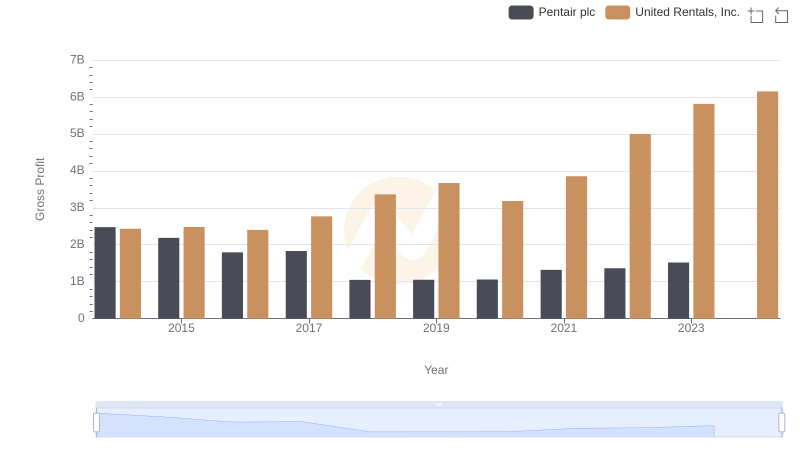
Who Generates Higher Gross Profit? United Rentals, Inc. or Pentair plc
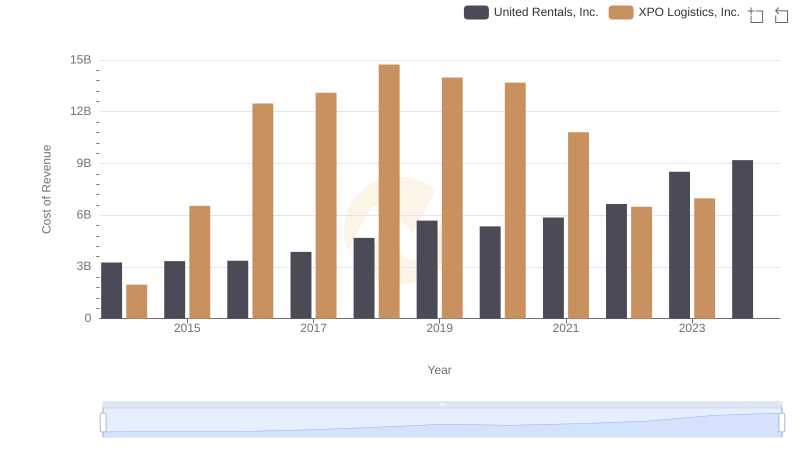
Cost of Revenue Trends: United Rentals, Inc. vs XPO Logistics, Inc.

Cost of Revenue: Key Insights for United Rentals, Inc. and Expeditors International of Washington, Inc.
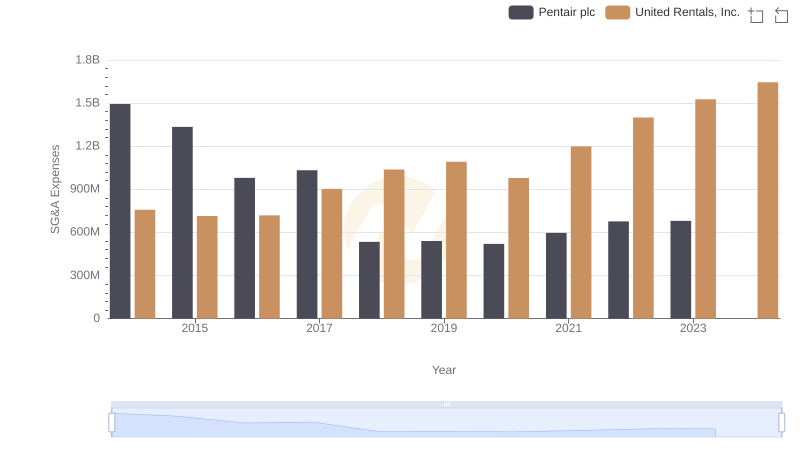
United Rentals, Inc. vs Pentair plc: SG&A Expense Trends
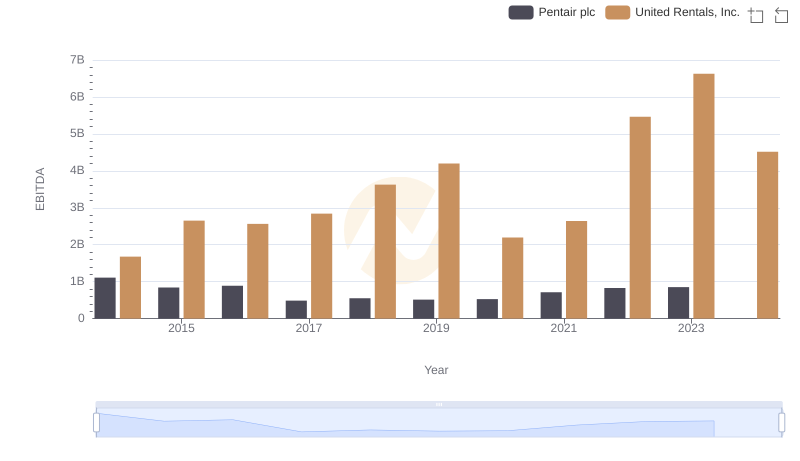
Comprehensive EBITDA Comparison: United Rentals, Inc. vs Pentair plc