| __timestamp | J.B. Hunt Transport Services, Inc. | United Rentals, Inc. |
|---|---|---|
| Wednesday, January 1, 2014 | 5124095000 | 3253000000 |
| Thursday, January 1, 2015 | 5041472000 | 3337000000 |
| Friday, January 1, 2016 | 5369826000 | 3359000000 |
| Sunday, January 1, 2017 | 5990275000 | 3872000000 |
| Monday, January 1, 2018 | 7255657000 | 4683000000 |
| Tuesday, January 1, 2019 | 7659003000 | 5681000000 |
| Wednesday, January 1, 2020 | 8186697000 | 5347000000 |
| Friday, January 1, 2021 | 10298483000 | 5863000000 |
| Saturday, January 1, 2022 | 12341472000 | 6646000000 |
| Sunday, January 1, 2023 | 10433277000 | 8519000000 |
| Monday, January 1, 2024 | 9195000000 |
Data in motion
In the ever-evolving landscape of American industry, the cost of revenue is a critical metric that reflects a company's operational efficiency. Over the past decade, United Rentals, Inc. and J.B. Hunt Transport Services, Inc. have showcased intriguing trends in their cost structures. From 2014 to 2023, J.B. Hunt's cost of revenue surged by approximately 104%, peaking in 2022, while United Rentals saw a 162% increase, reaching its zenith in 2024. This growth trajectory highlights the dynamic nature of these industries, with J.B. Hunt's costs consistently outpacing United Rentals until 2023. The data reveals a fascinating shift in 2023, where United Rentals closed the gap significantly, indicating strategic adjustments. Missing data for 2024 in J.B. Hunt's records suggests a potential recalibration phase. These insights underscore the importance of cost management in maintaining competitive advantage.
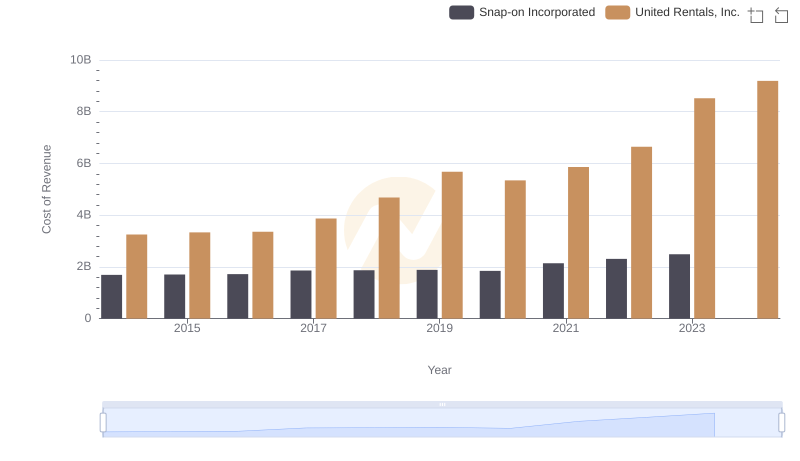
Cost Insights: Breaking Down United Rentals, Inc. and Snap-on Incorporated's Expenses
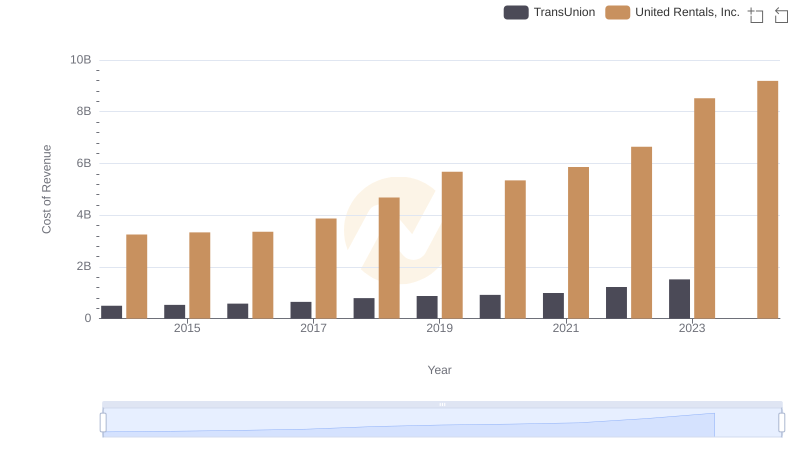
Cost of Revenue: Key Insights for United Rentals, Inc. and TransUnion
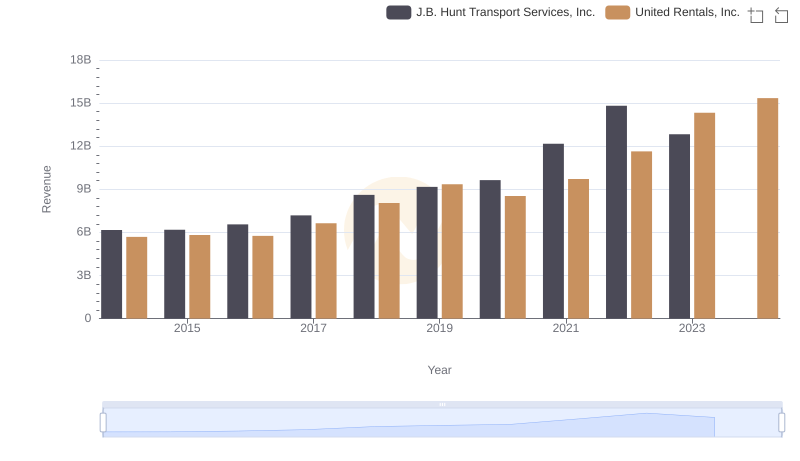
United Rentals, Inc. vs J.B. Hunt Transport Services, Inc.: Examining Key Revenue Metrics
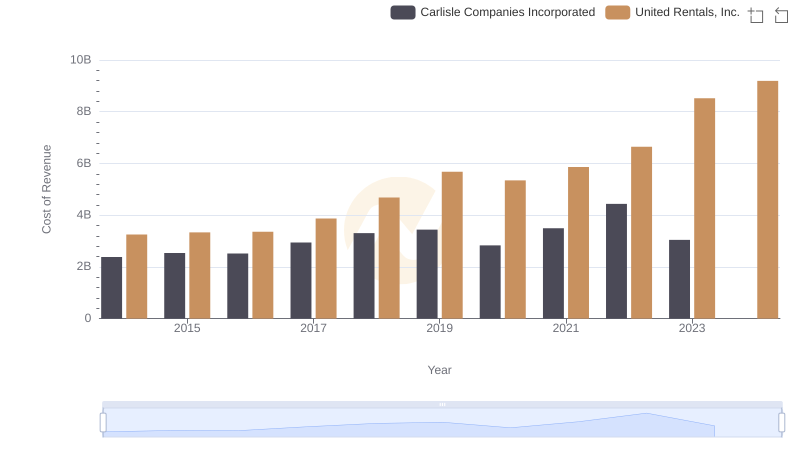
Analyzing Cost of Revenue: United Rentals, Inc. and Carlisle Companies Incorporated
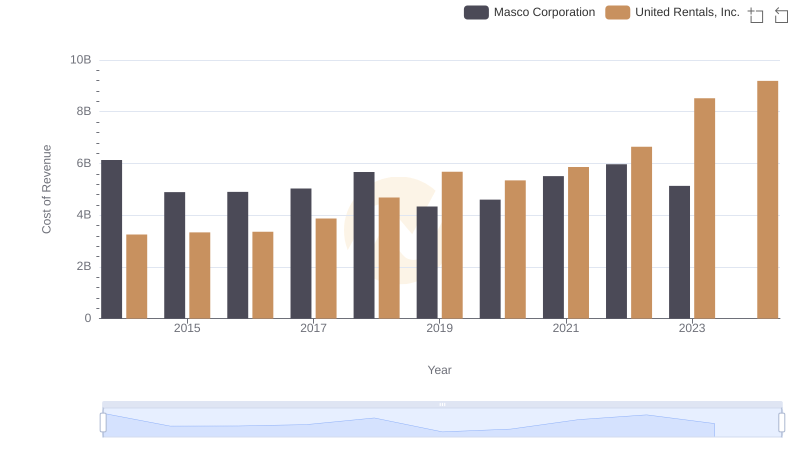
Comparing Cost of Revenue Efficiency: United Rentals, Inc. vs Masco Corporation
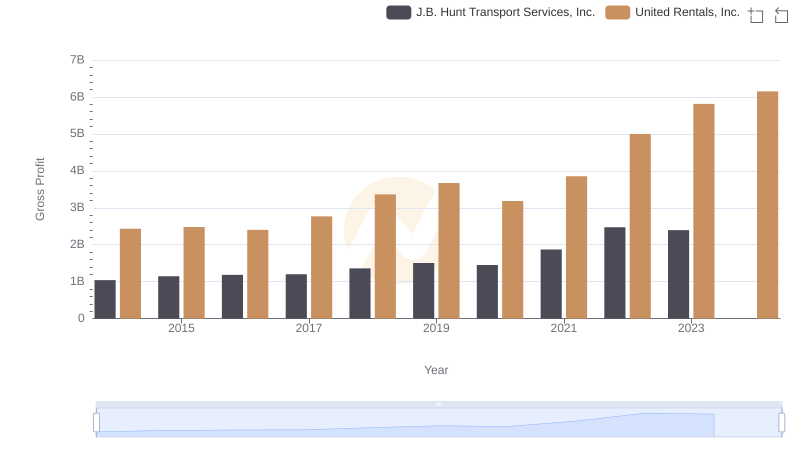
Gross Profit Comparison: United Rentals, Inc. and J.B. Hunt Transport Services, Inc. Trends
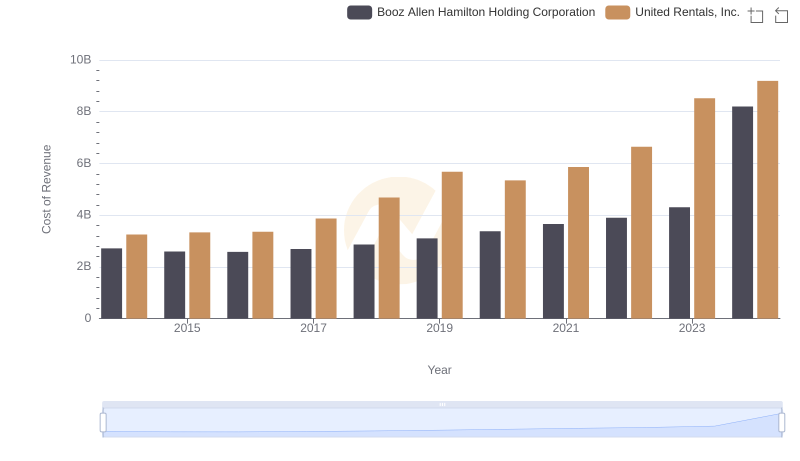
Cost of Revenue: Key Insights for United Rentals, Inc. and Booz Allen Hamilton Holding Corporation
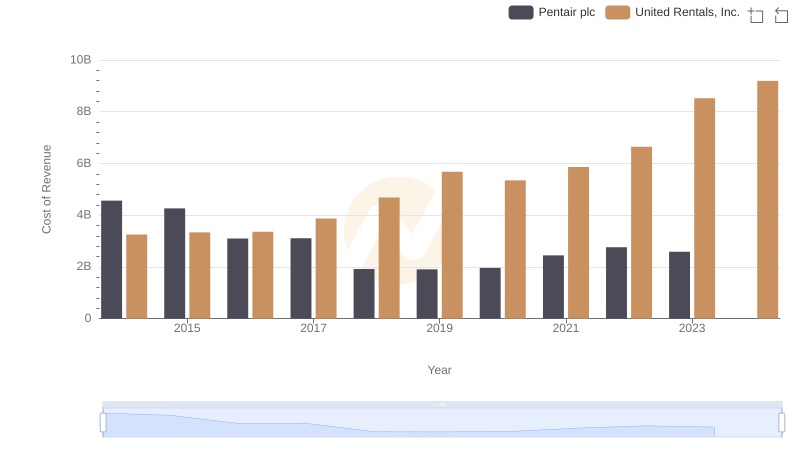
Analyzing Cost of Revenue: United Rentals, Inc. and Pentair plc
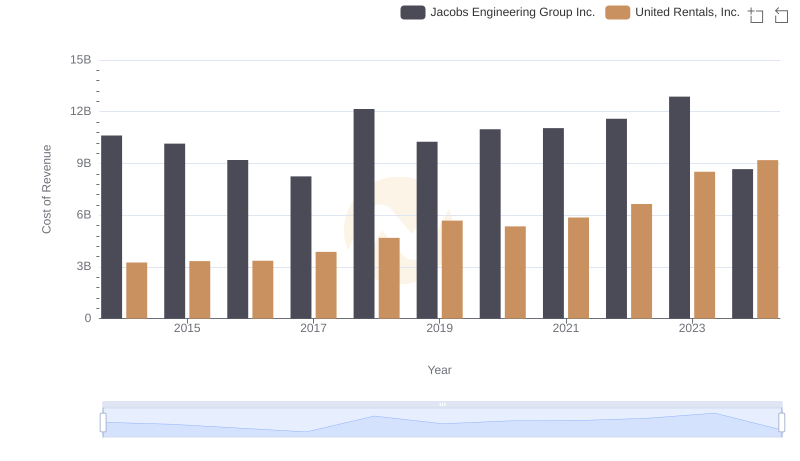
Cost Insights: Breaking Down United Rentals, Inc. and Jacobs Engineering Group Inc.'s Expenses
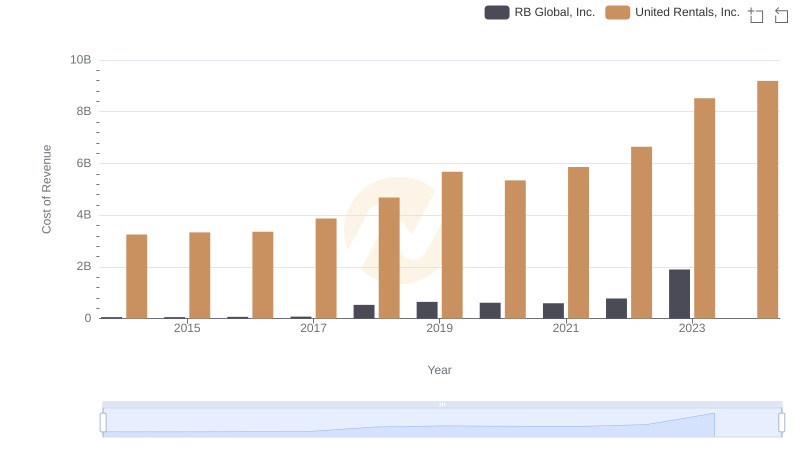
Cost of Revenue Comparison: United Rentals, Inc. vs RB Global, Inc.
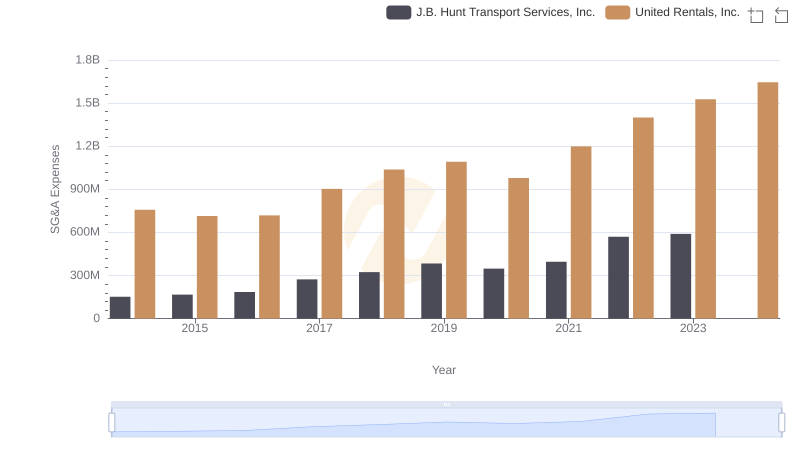
Breaking Down SG&A Expenses: United Rentals, Inc. vs J.B. Hunt Transport Services, Inc.
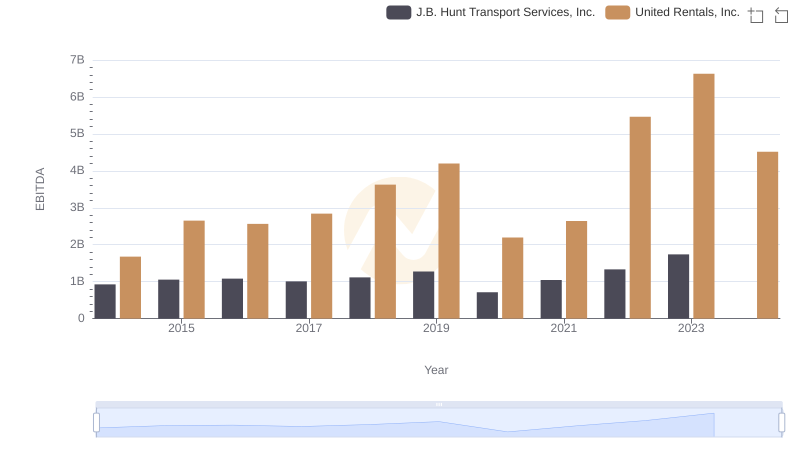
EBITDA Analysis: Evaluating United Rentals, Inc. Against J.B. Hunt Transport Services, Inc.