| __timestamp | Jacobs Engineering Group Inc. | United Rentals, Inc. |
|---|---|---|
| Wednesday, January 1, 2014 | 10621373000 | 3253000000 |
| Thursday, January 1, 2015 | 10146494000 | 3337000000 |
| Friday, January 1, 2016 | 9196326000 | 3359000000 |
| Sunday, January 1, 2017 | 8250536000 | 3872000000 |
| Monday, January 1, 2018 | 12156276000 | 4683000000 |
| Tuesday, January 1, 2019 | 10260840000 | 5681000000 |
| Wednesday, January 1, 2020 | 10980307000 | 5347000000 |
| Friday, January 1, 2021 | 11048860000 | 5863000000 |
| Saturday, January 1, 2022 | 11595785000 | 6646000000 |
| Sunday, January 1, 2023 | 12879099000 | 8519000000 |
| Monday, January 1, 2024 | 8668185000 | 9195000000 |
Unlocking the unknown
In the ever-evolving landscape of industrial services, understanding cost dynamics is crucial. Over the past decade, United Rentals, Inc. and Jacobs Engineering Group Inc. have showcased distinct cost trajectories. From 2014 to 2023, Jacobs Engineering's cost of revenue fluctuated, peaking in 2023 with a 25% increase from its 2014 figures. Meanwhile, United Rentals demonstrated a robust growth pattern, with costs rising by approximately 162% over the same period. This trend highlights United Rentals' aggressive expansion strategy, while Jacobs Engineering's costs reflect a more volatile market adaptation. As we step into 2024, United Rentals' costs have surpassed Jacobs Engineering, marking a significant shift in industry dynamics. These insights not only reveal the financial strategies of these giants but also provide a window into the broader economic trends shaping the industrial sector.
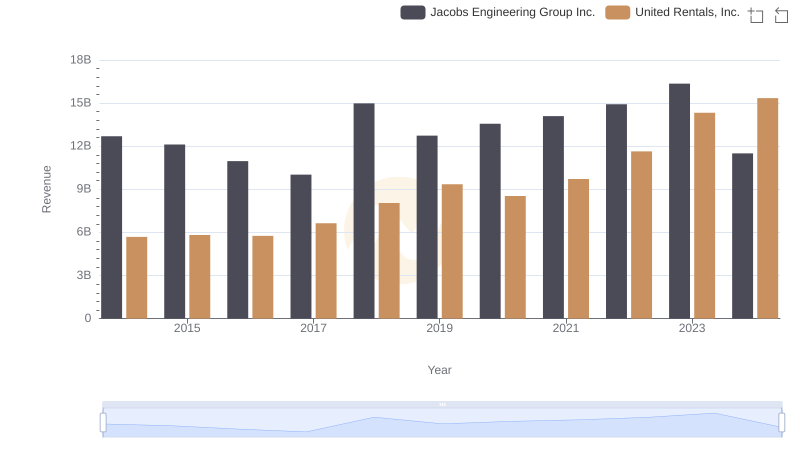
United Rentals, Inc. vs Jacobs Engineering Group Inc.: Annual Revenue Growth Compared
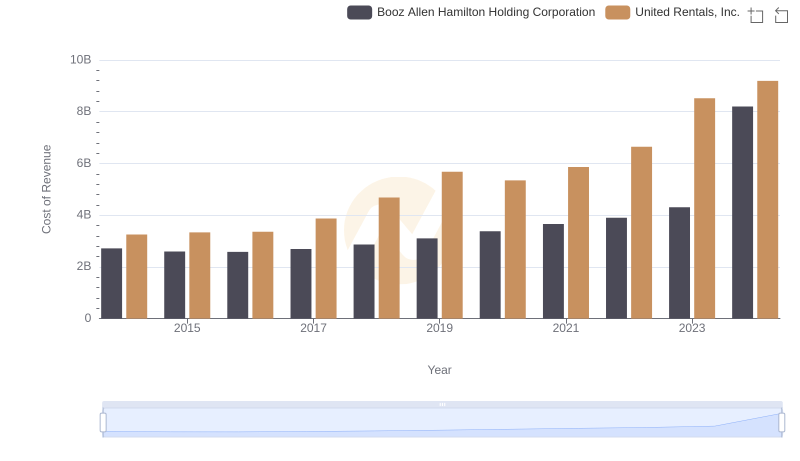
Cost of Revenue: Key Insights for United Rentals, Inc. and Booz Allen Hamilton Holding Corporation
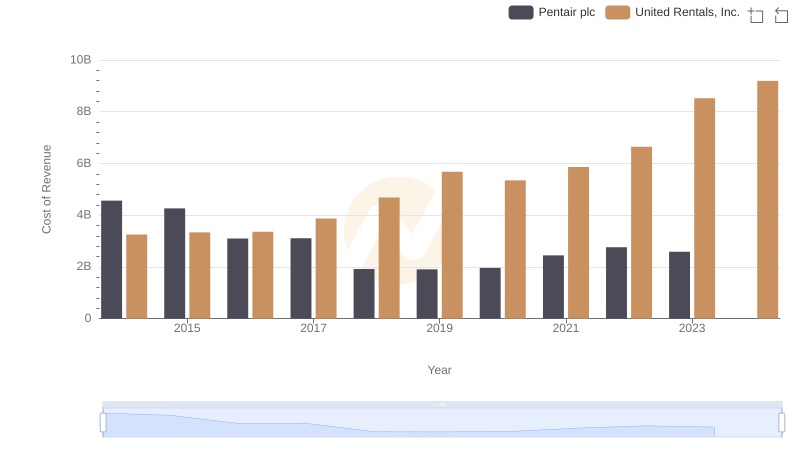
Analyzing Cost of Revenue: United Rentals, Inc. and Pentair plc
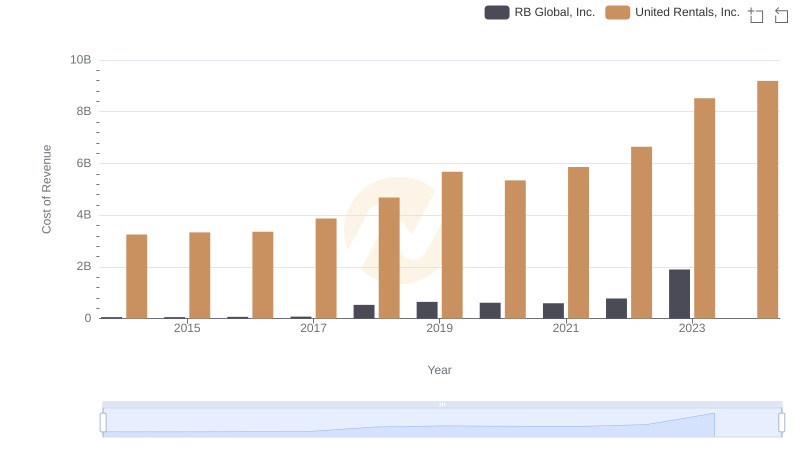
Cost of Revenue Comparison: United Rentals, Inc. vs RB Global, Inc.
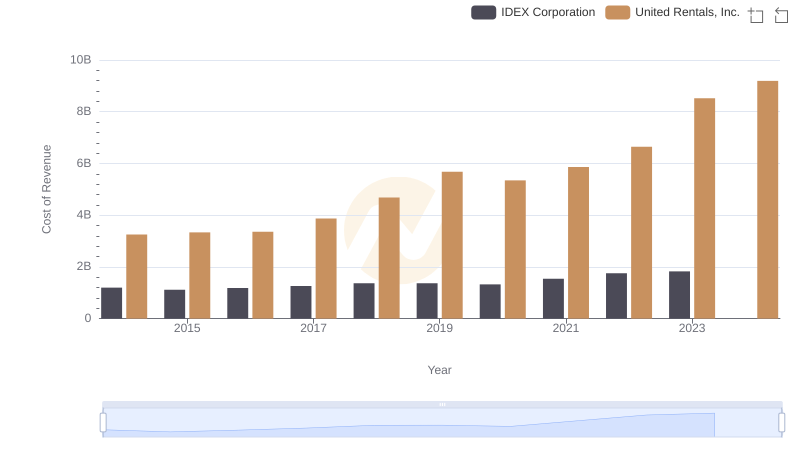
Analyzing Cost of Revenue: United Rentals, Inc. and IDEX Corporation
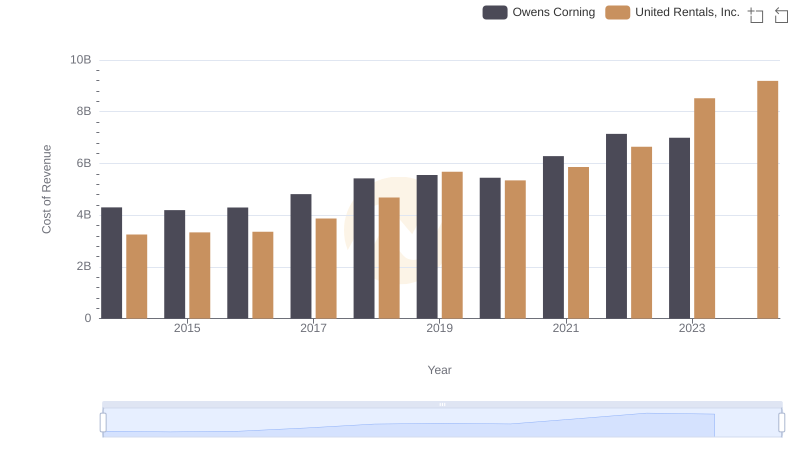
Analyzing Cost of Revenue: United Rentals, Inc. and Owens Corning
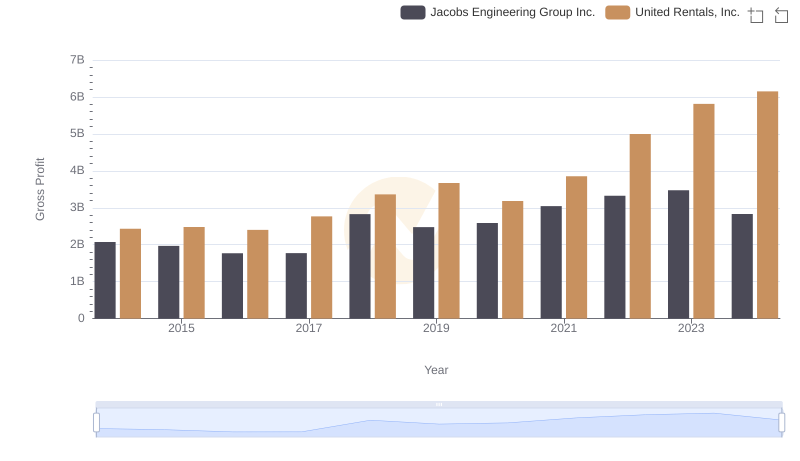
United Rentals, Inc. and Jacobs Engineering Group Inc.: A Detailed Gross Profit Analysis
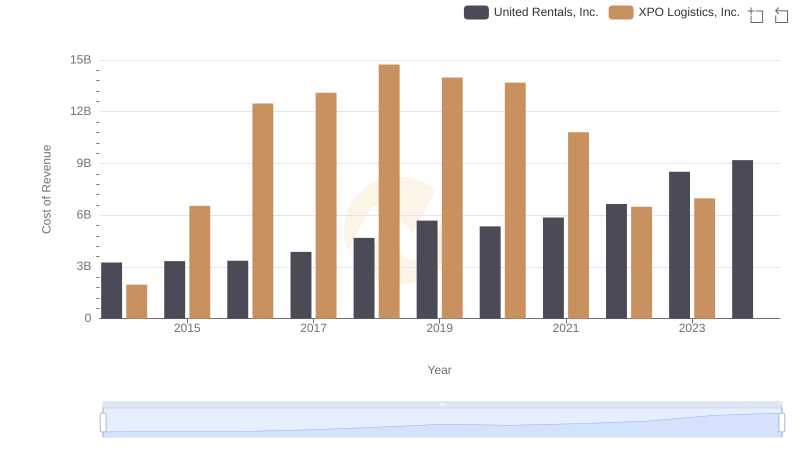
Cost of Revenue Trends: United Rentals, Inc. vs XPO Logistics, Inc.

Cost of Revenue: Key Insights for United Rentals, Inc. and Expeditors International of Washington, Inc.
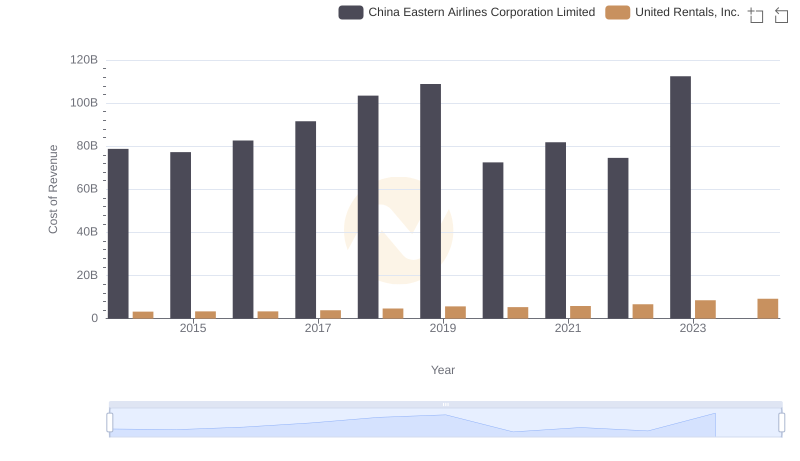
Cost of Revenue: Key Insights for United Rentals, Inc. and China Eastern Airlines Corporation Limited
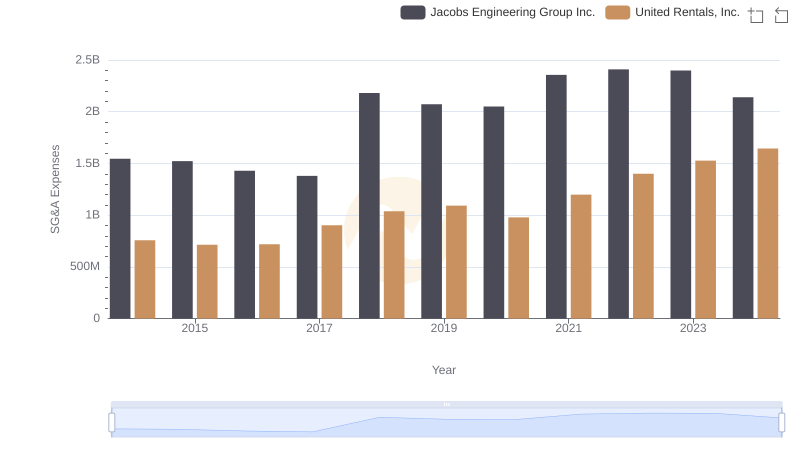
Who Optimizes SG&A Costs Better? United Rentals, Inc. or Jacobs Engineering Group Inc.
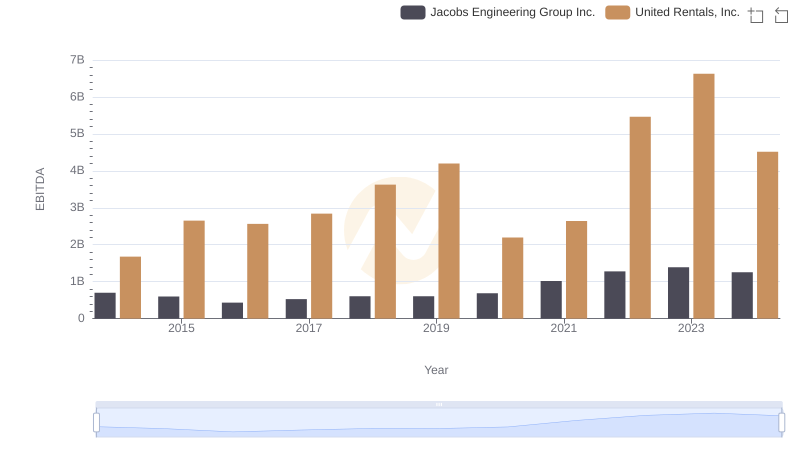
EBITDA Performance Review: United Rentals, Inc. vs Jacobs Engineering Group Inc.