| __timestamp | Booz Allen Hamilton Holding Corporation | United Rentals, Inc. |
|---|---|---|
| Wednesday, January 1, 2014 | 2716113000 | 3253000000 |
| Thursday, January 1, 2015 | 2593849000 | 3337000000 |
| Friday, January 1, 2016 | 2580026000 | 3359000000 |
| Sunday, January 1, 2017 | 2691982000 | 3872000000 |
| Monday, January 1, 2018 | 2867103000 | 4683000000 |
| Tuesday, January 1, 2019 | 3100466000 | 5681000000 |
| Wednesday, January 1, 2020 | 3379180000 | 5347000000 |
| Friday, January 1, 2021 | 3657530000 | 5863000000 |
| Saturday, January 1, 2022 | 3899622000 | 6646000000 |
| Sunday, January 1, 2023 | 4304810000 | 8519000000 |
| Monday, January 1, 2024 | 8202847000 | 9195000000 |
Cracking the code
In the ever-evolving landscape of corporate finance, understanding cost structures is crucial. This analysis delves into the cost of revenue trends for United Rentals, Inc. and Booz Allen Hamilton Holding Corporation from 2014 to 2024. Over this decade, United Rentals has seen a significant increase in its cost of revenue, rising by approximately 183%, from $3.25 billion in 2014 to an estimated $9.19 billion in 2024. This growth reflects the company's expanding operations and market reach.
Conversely, Booz Allen Hamilton's cost of revenue has also surged, albeit at a slower pace, increasing by around 202% over the same period. The company's strategic investments in technology and consulting services have contributed to this upward trend. These insights highlight the dynamic nature of cost management in different sectors, offering a glimpse into the strategic priorities of these industry leaders.
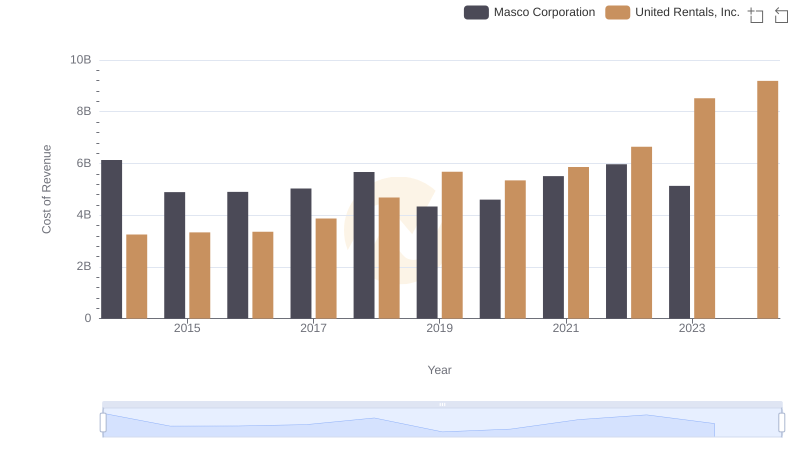
Comparing Cost of Revenue Efficiency: United Rentals, Inc. vs Masco Corporation
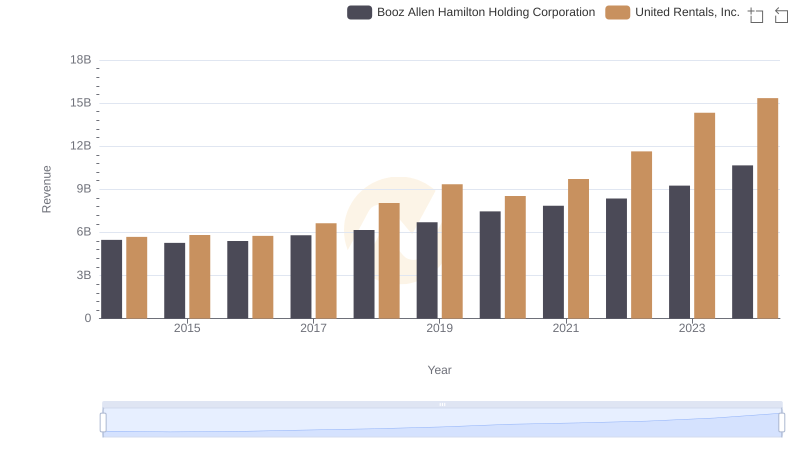
United Rentals, Inc. and Booz Allen Hamilton Holding Corporation: A Comprehensive Revenue Analysis
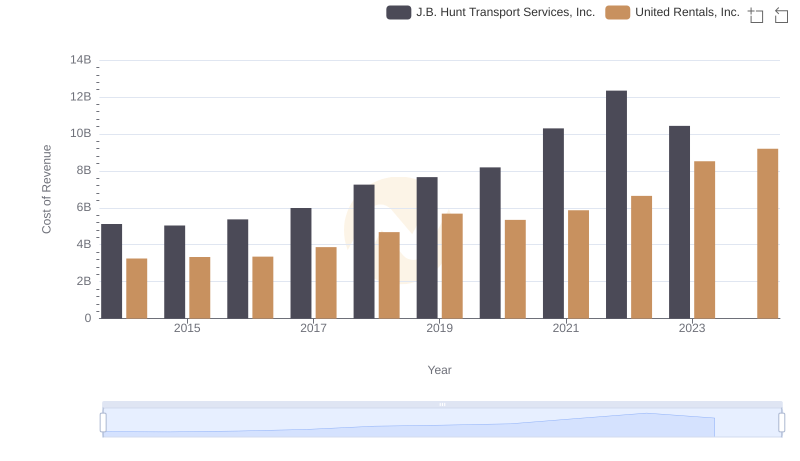
Cost of Revenue Comparison: United Rentals, Inc. vs J.B. Hunt Transport Services, Inc.
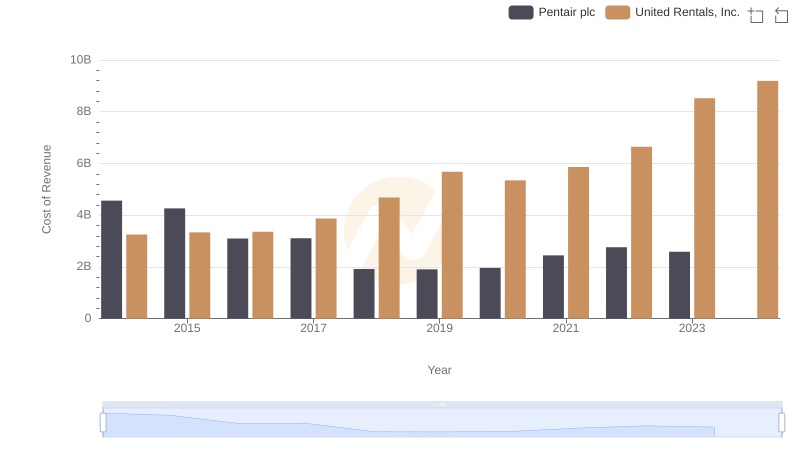
Analyzing Cost of Revenue: United Rentals, Inc. and Pentair plc
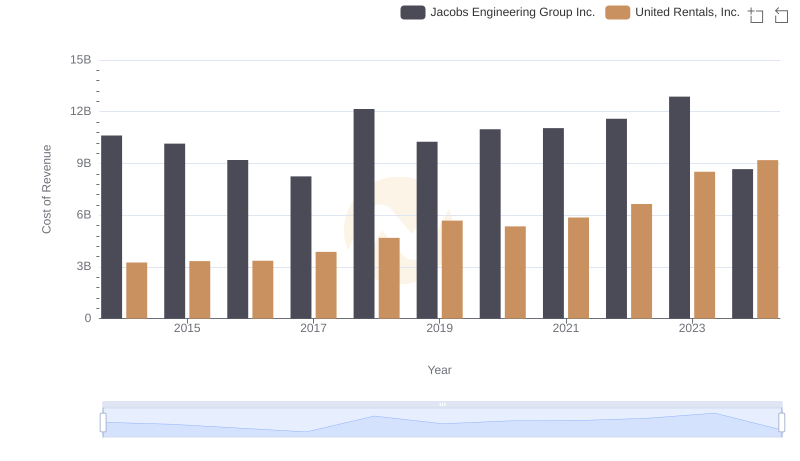
Cost Insights: Breaking Down United Rentals, Inc. and Jacobs Engineering Group Inc.'s Expenses
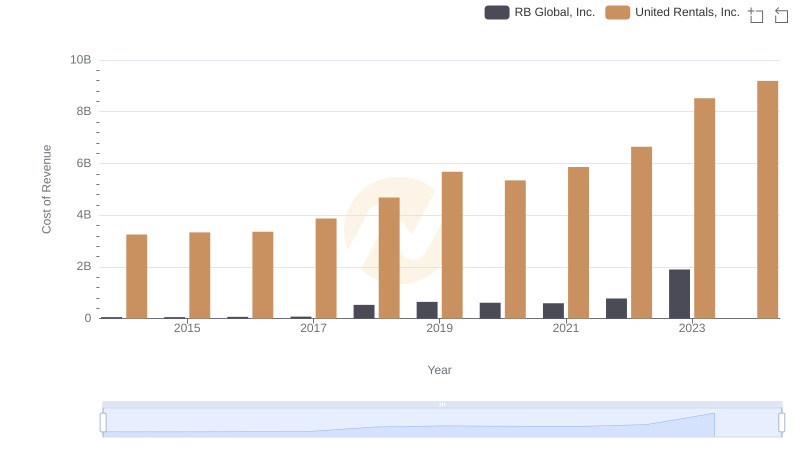
Cost of Revenue Comparison: United Rentals, Inc. vs RB Global, Inc.
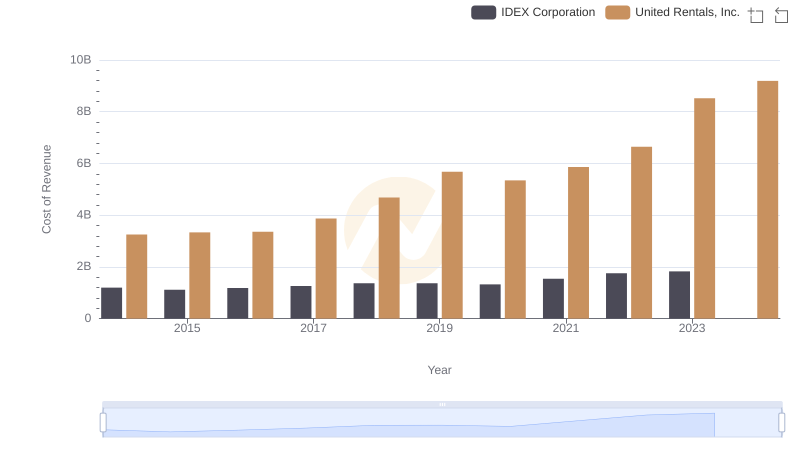
Analyzing Cost of Revenue: United Rentals, Inc. and IDEX Corporation
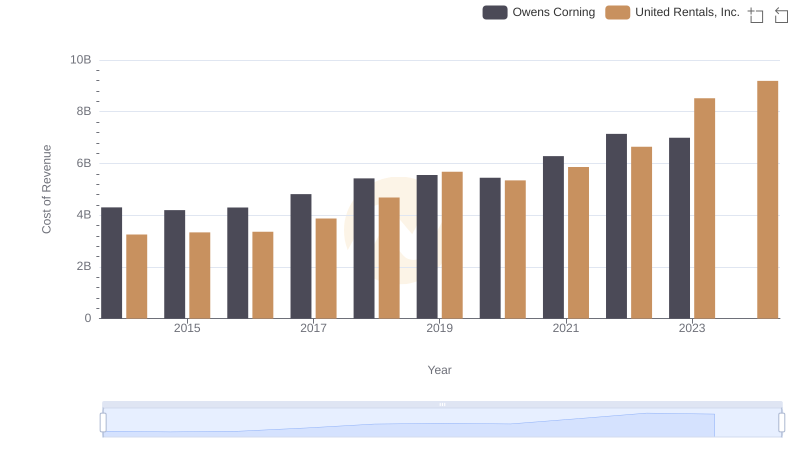
Analyzing Cost of Revenue: United Rentals, Inc. and Owens Corning
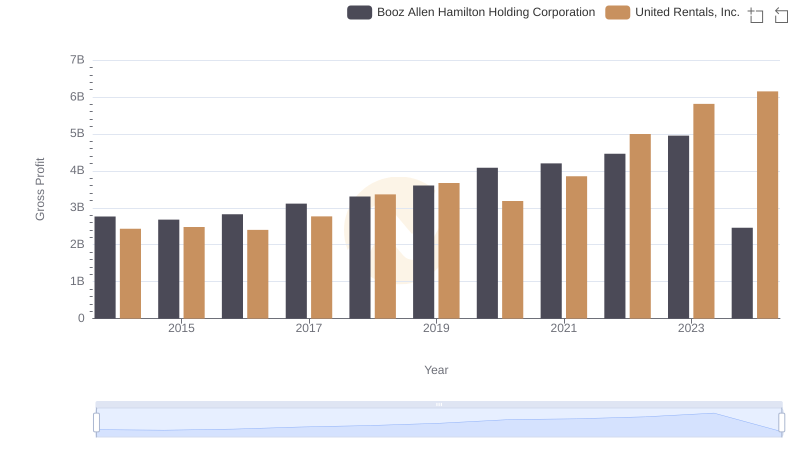
Gross Profit Comparison: United Rentals, Inc. and Booz Allen Hamilton Holding Corporation Trends
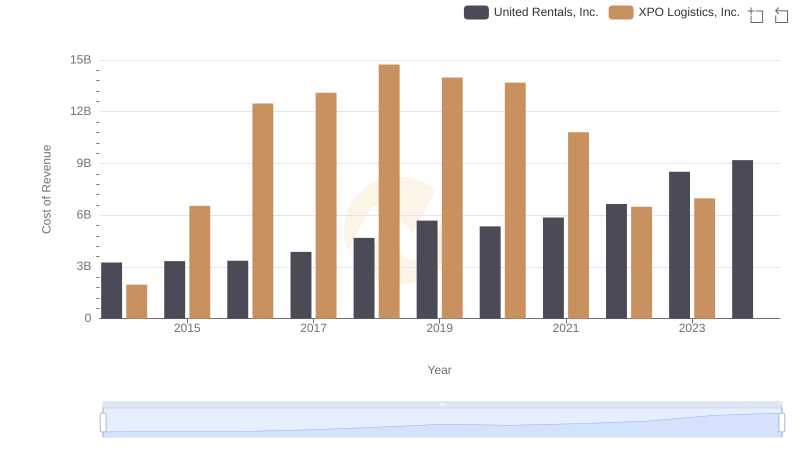
Cost of Revenue Trends: United Rentals, Inc. vs XPO Logistics, Inc.
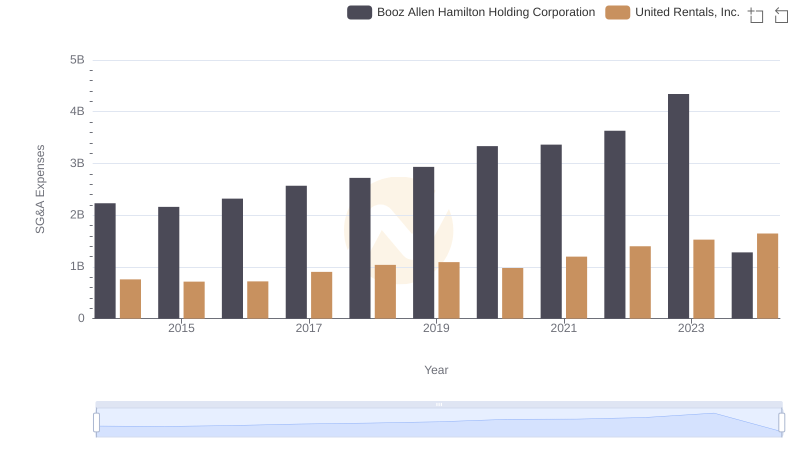
United Rentals, Inc. and Booz Allen Hamilton Holding Corporation: SG&A Spending Patterns Compared