| __timestamp | CDW Corporation | Cisco Systems, Inc. |
|---|---|---|
| Wednesday, January 1, 2014 | 10153200000 | 19373000000 |
| Thursday, January 1, 2015 | 10872900000 | 19480000000 |
| Friday, January 1, 2016 | 11654700000 | 18287000000 |
| Sunday, January 1, 2017 | 12741600000 | 17781000000 |
| Monday, January 1, 2018 | 13533600000 | 18724000000 |
| Tuesday, January 1, 2019 | 14992500000 | 19238000000 |
| Wednesday, January 1, 2020 | 15257400000 | 17618000000 |
| Friday, January 1, 2021 | 17252300000 | 17924000000 |
| Saturday, January 1, 2022 | 19062100000 | 19309000000 |
| Sunday, January 1, 2023 | 16723599999 | 21245000000 |
| Monday, January 1, 2024 | 16396300000 | 18975000000 |
Unveiling the hidden dimensions of data
In the ever-evolving tech industry, efficiency in managing costs is paramount. This analysis delves into the cost of revenue efficiency of two industry titans: Cisco Systems, Inc. and CDW Corporation, from 2014 to 2023. Over this decade, Cisco consistently maintained a higher cost of revenue, peaking at approximately $21.2 billion in 2023, reflecting its expansive operations. In contrast, CDW's cost of revenue grew steadily, reaching its zenith in 2022 at around $19.1 billion, before a slight dip in 2023.
Despite Cisco's larger scale, both companies demonstrated a similar downward trend in cost efficiency, with a decrease of about 2% annually. This trend highlights the competitive nature of the tech sector, where both companies strive to optimize their operations. Notably, data for CDW in 2024 is missing, leaving room for speculation on its future trajectory.
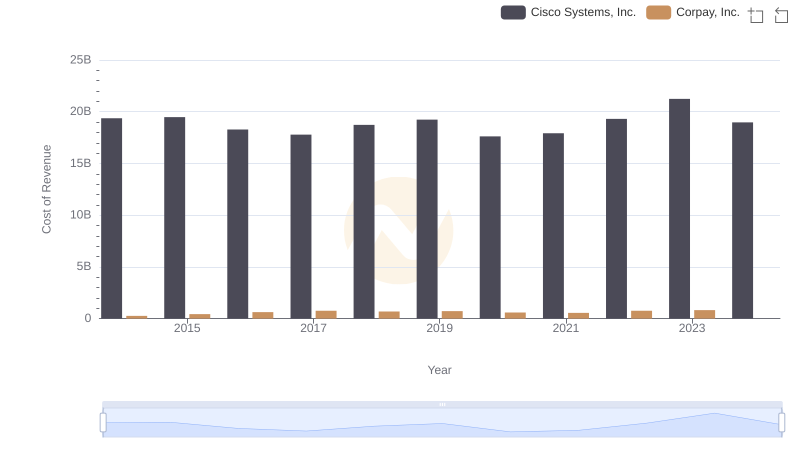
Cost of Revenue Comparison: Cisco Systems, Inc. vs Corpay, Inc.
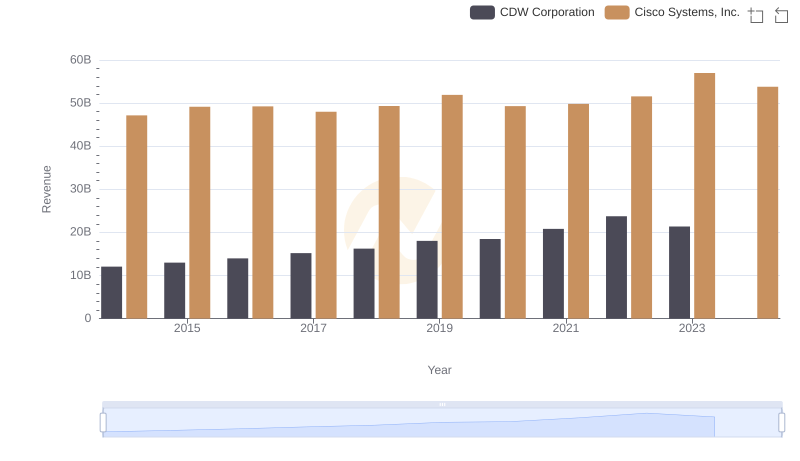
Cisco Systems, Inc. vs CDW Corporation: Annual Revenue Growth Compared
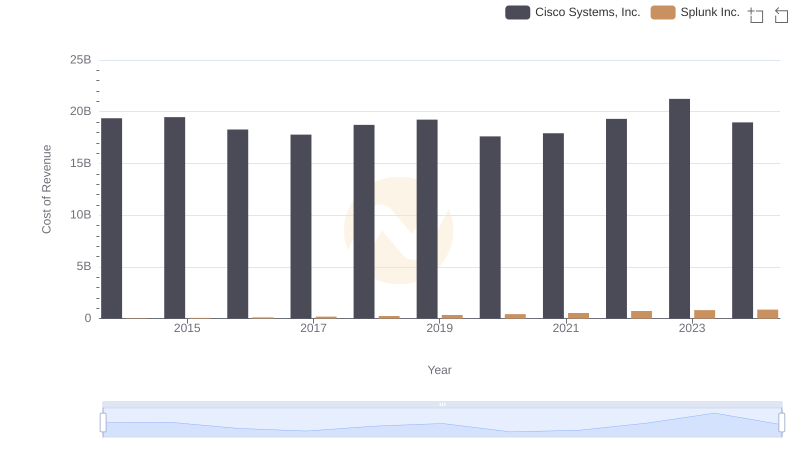
Analyzing Cost of Revenue: Cisco Systems, Inc. and Splunk Inc.
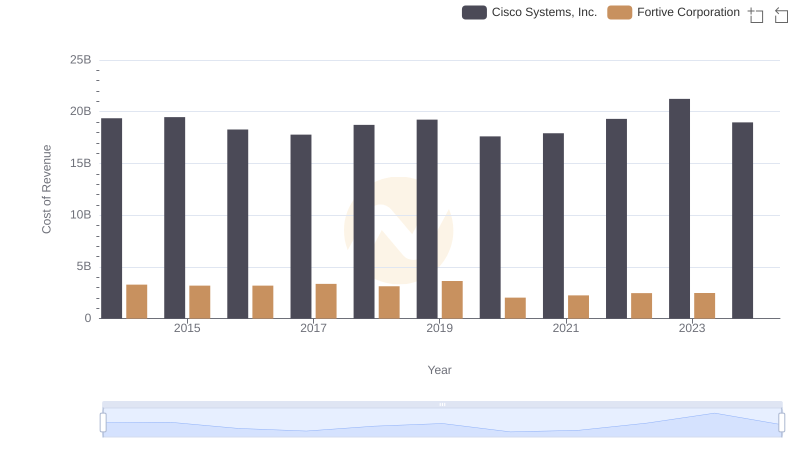
Comparing Cost of Revenue Efficiency: Cisco Systems, Inc. vs Fortive Corporation
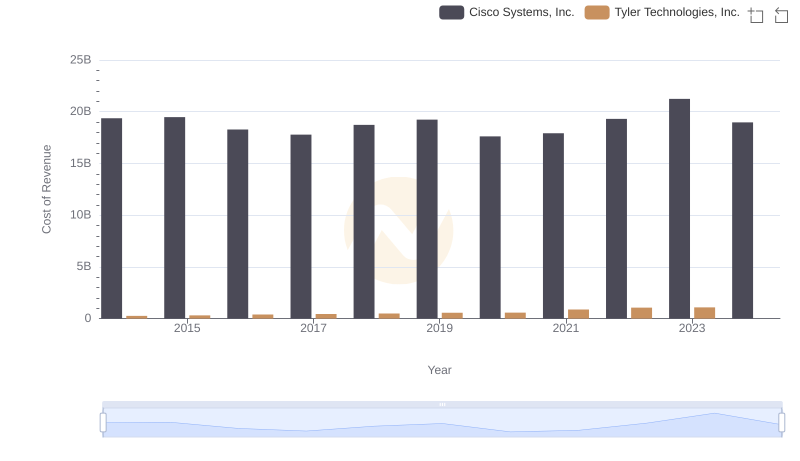
Cost of Revenue Trends: Cisco Systems, Inc. vs Tyler Technologies, Inc.
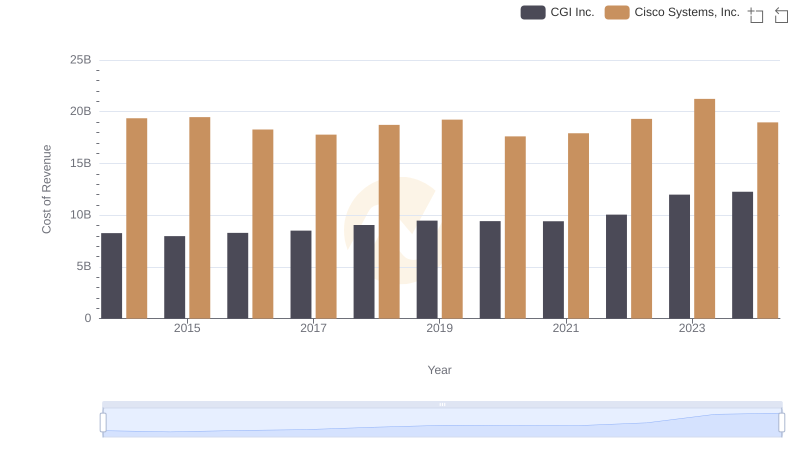
Cisco Systems, Inc. vs CGI Inc.: Efficiency in Cost of Revenue Explored
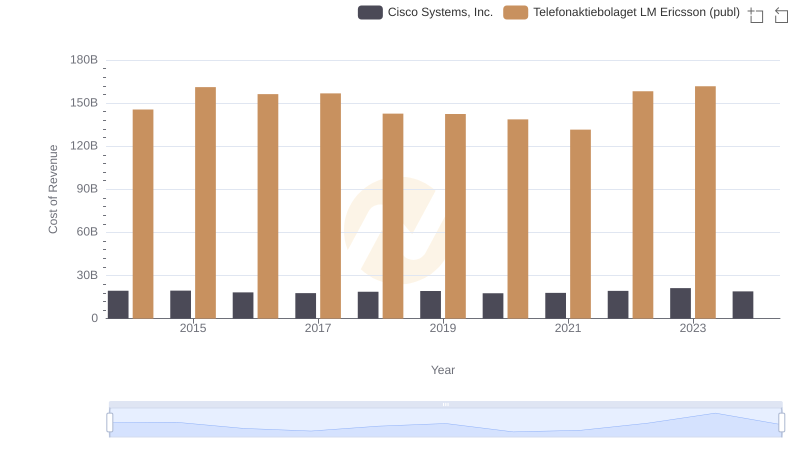
Cost of Revenue: Key Insights for Cisco Systems, Inc. and Telefonaktiebolaget LM Ericsson (publ)
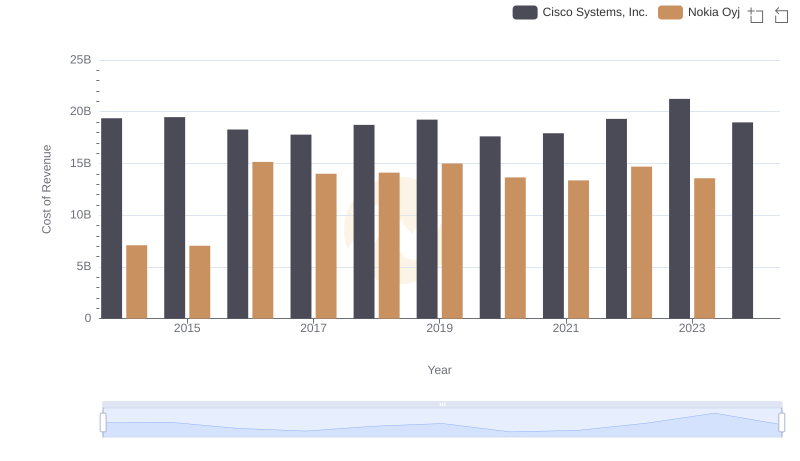
Cost Insights: Breaking Down Cisco Systems, Inc. and Nokia Oyj's Expenses
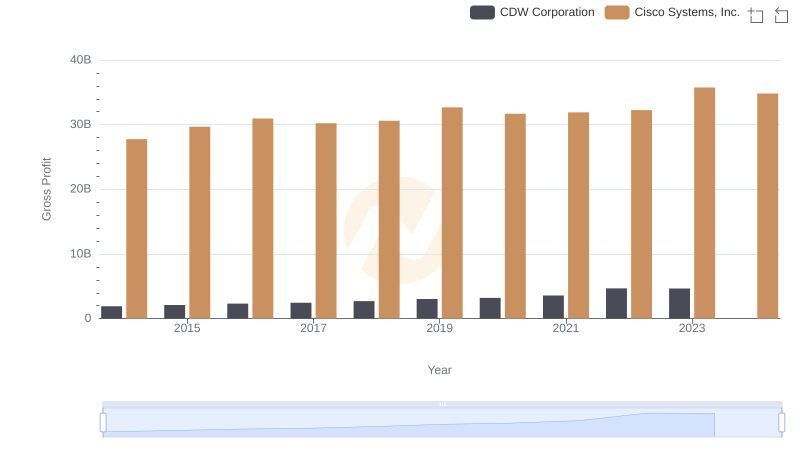
Cisco Systems, Inc. vs CDW Corporation: A Gross Profit Performance Breakdown
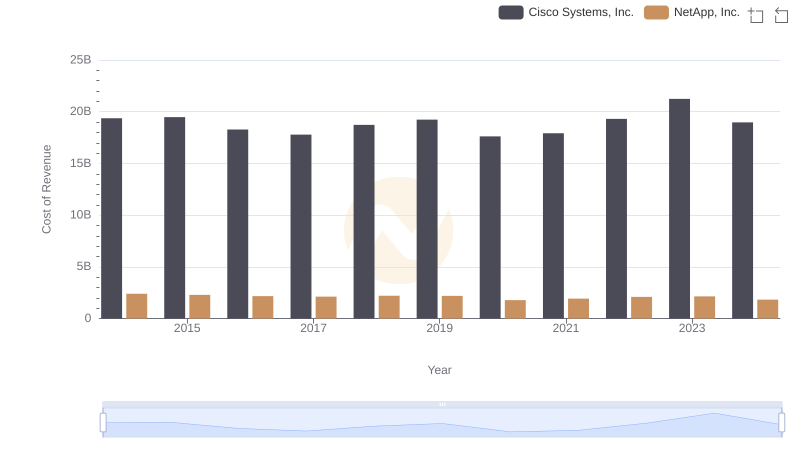
Comparing Cost of Revenue Efficiency: Cisco Systems, Inc. vs NetApp, Inc.
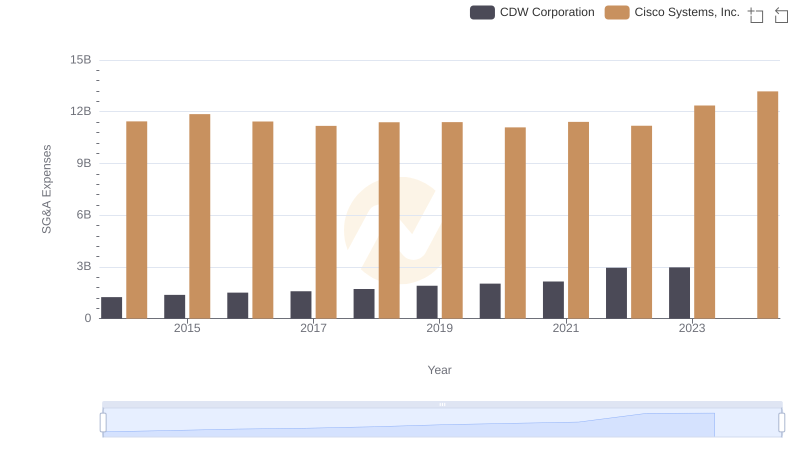
Cisco Systems, Inc. or CDW Corporation: Who Manages SG&A Costs Better?
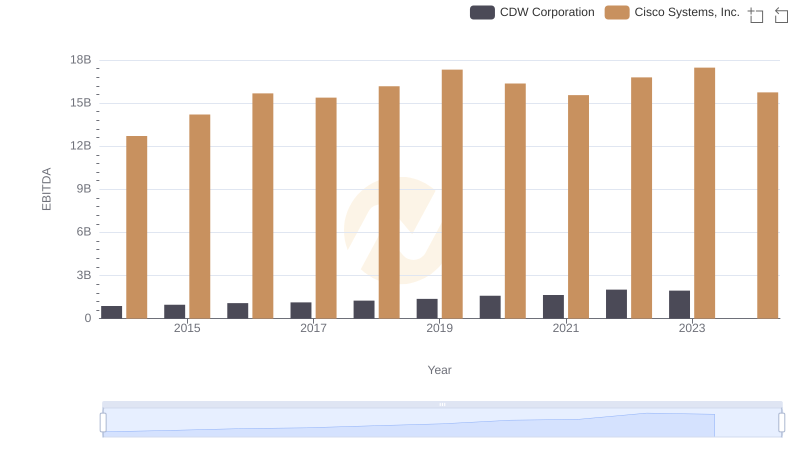
A Side-by-Side Analysis of EBITDA: Cisco Systems, Inc. and CDW Corporation