| __timestamp | CDW Corporation | Cisco Systems, Inc. |
|---|---|---|
| Wednesday, January 1, 2014 | 880900000 | 12709000000 |
| Thursday, January 1, 2015 | 969400000 | 14209000000 |
| Friday, January 1, 2016 | 1074500000 | 15678000000 |
| Sunday, January 1, 2017 | 1127400000 | 15383000000 |
| Monday, January 1, 2018 | 1252900000 | 16172000000 |
| Tuesday, January 1, 2019 | 1371100000 | 17334000000 |
| Wednesday, January 1, 2020 | 1588200000 | 16363000000 |
| Friday, January 1, 2021 | 1642200000 | 15558000000 |
| Saturday, January 1, 2022 | 2018100000 | 16794000000 |
| Sunday, January 1, 2023 | 1947800000 | 17471000000 |
| Monday, January 1, 2024 | 1651300000 | 15747000000 |
Unleashing insights
In the ever-evolving landscape of technology, Cisco Systems, Inc. and CDW Corporation have emerged as significant players. Over the past decade, Cisco's EBITDA has consistently outperformed CDW's, with Cisco averaging around $15.8 billion annually, compared to CDW's $1.4 billion. This disparity highlights Cisco's dominant market position and operational efficiency.
From 2014 to 2023, Cisco's EBITDA grew by approximately 37%, peaking in 2023, while CDW saw a remarkable 121% increase, reflecting its aggressive growth strategy. Notably, 2022 marked a high point for CDW, with a 23% surge in EBITDA, underscoring its resilience amidst market challenges.
As we look to the future, the absence of CDW's 2024 data leaves room for speculation. Will CDW continue its upward trajectory, or will Cisco maintain its lead? This analysis provides a snapshot of the financial health and strategic direction of these tech giants.
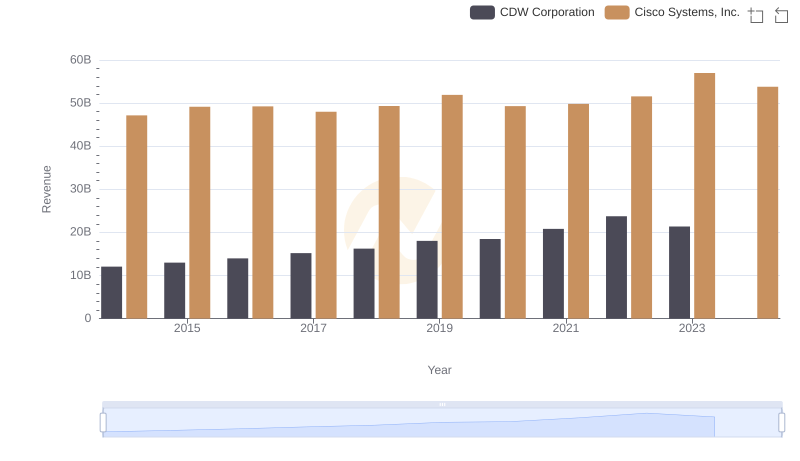
Cisco Systems, Inc. vs CDW Corporation: Annual Revenue Growth Compared
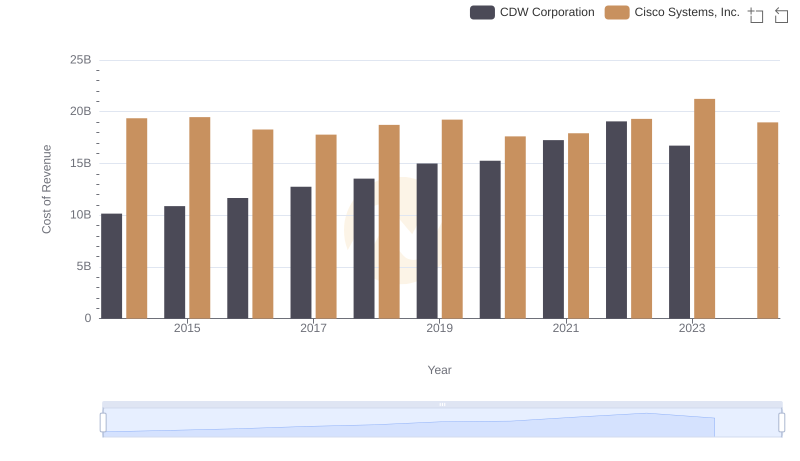
Comparing Cost of Revenue Efficiency: Cisco Systems, Inc. vs CDW Corporation

EBITDA Performance Review: Cisco Systems, Inc. vs II-VI Incorporated
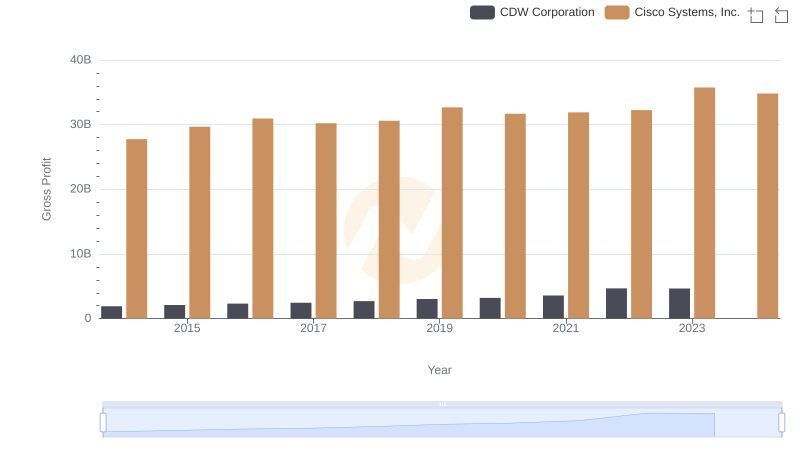
Cisco Systems, Inc. vs CDW Corporation: A Gross Profit Performance Breakdown
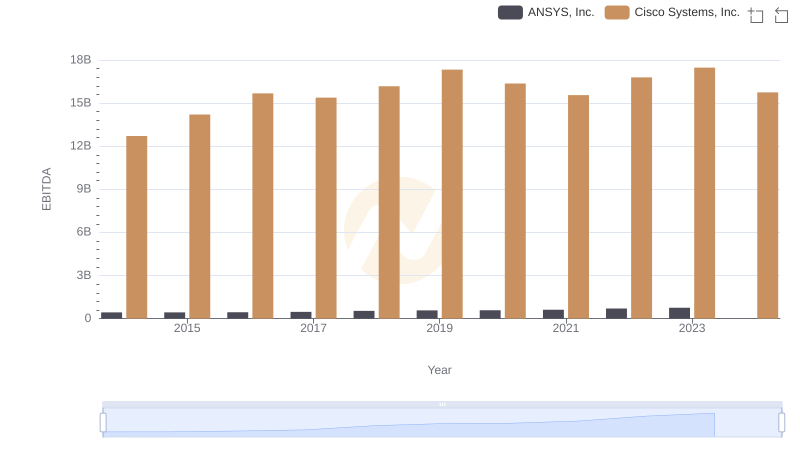
A Side-by-Side Analysis of EBITDA: Cisco Systems, Inc. and ANSYS, Inc.
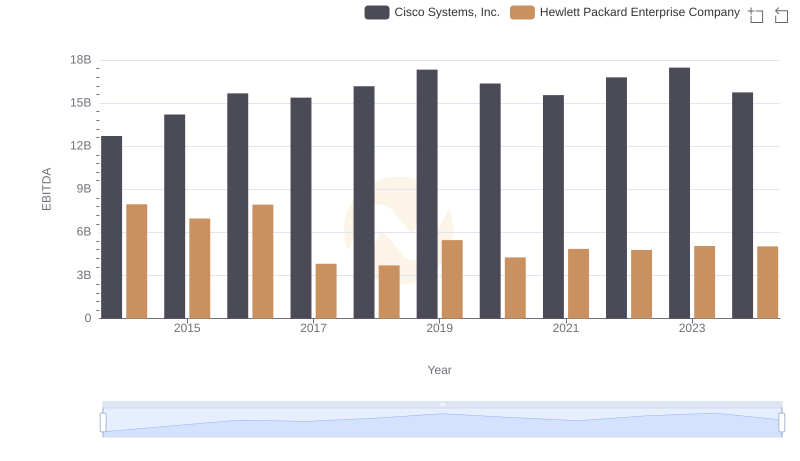
Comparative EBITDA Analysis: Cisco Systems, Inc. vs Hewlett Packard Enterprise Company
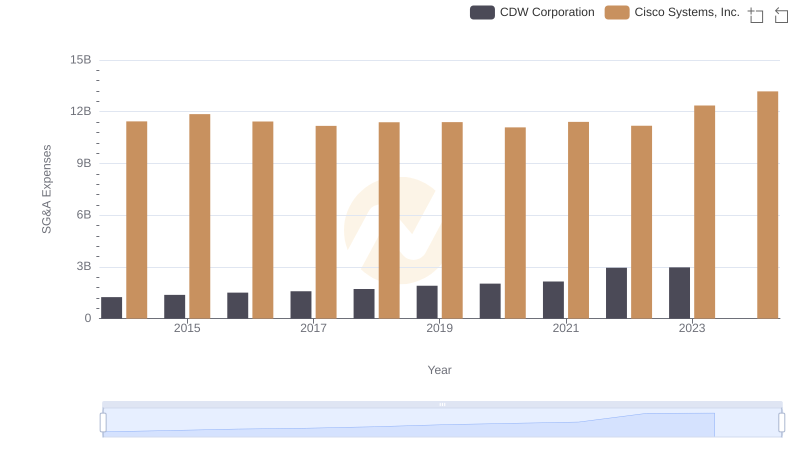
Cisco Systems, Inc. or CDW Corporation: Who Manages SG&A Costs Better?
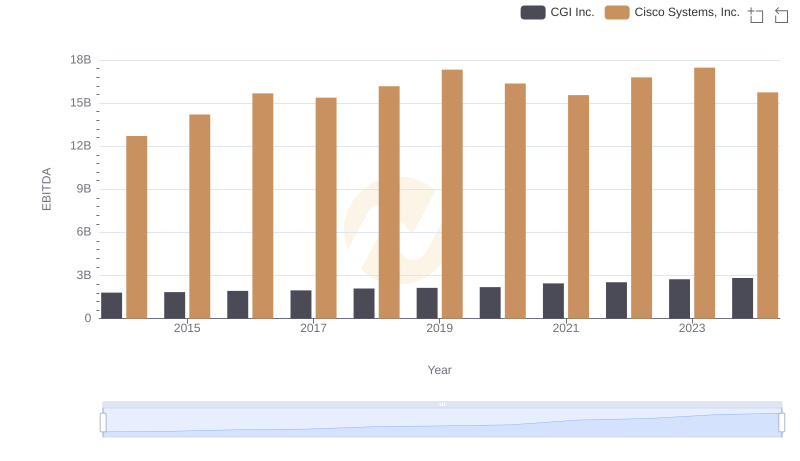
EBITDA Analysis: Evaluating Cisco Systems, Inc. Against CGI Inc.
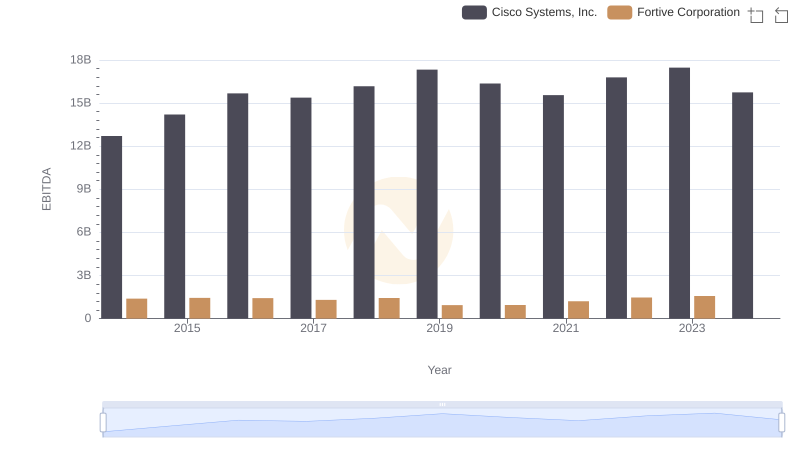
Comprehensive EBITDA Comparison: Cisco Systems, Inc. vs Fortive Corporation
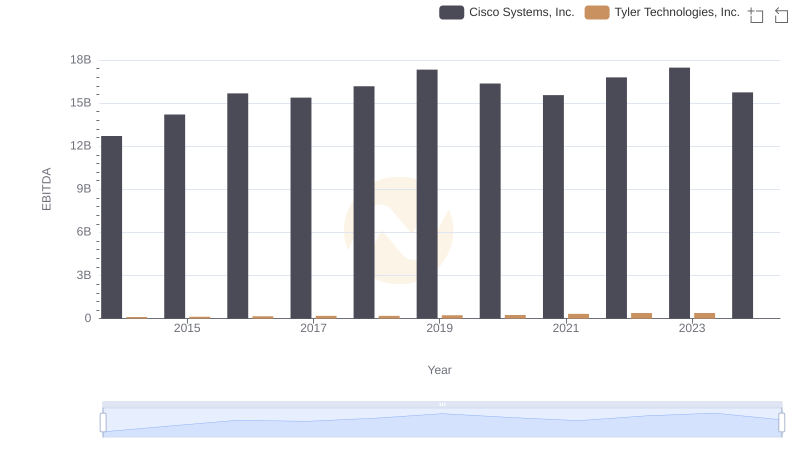
EBITDA Performance Review: Cisco Systems, Inc. vs Tyler Technologies, Inc.
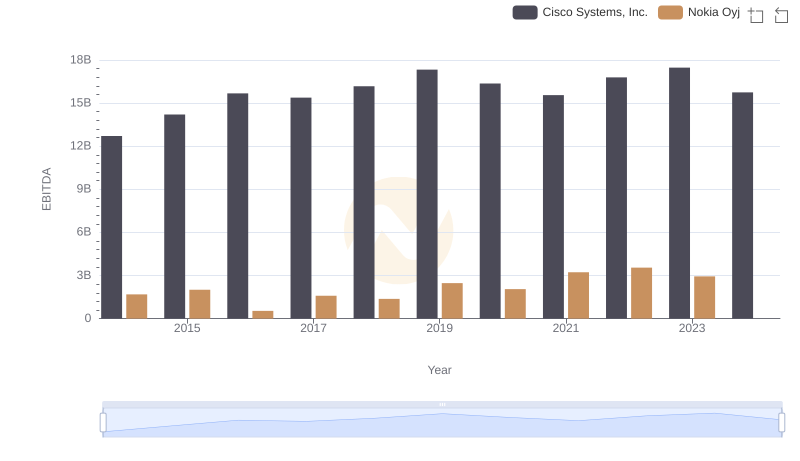
Professional EBITDA Benchmarking: Cisco Systems, Inc. vs Nokia Oyj
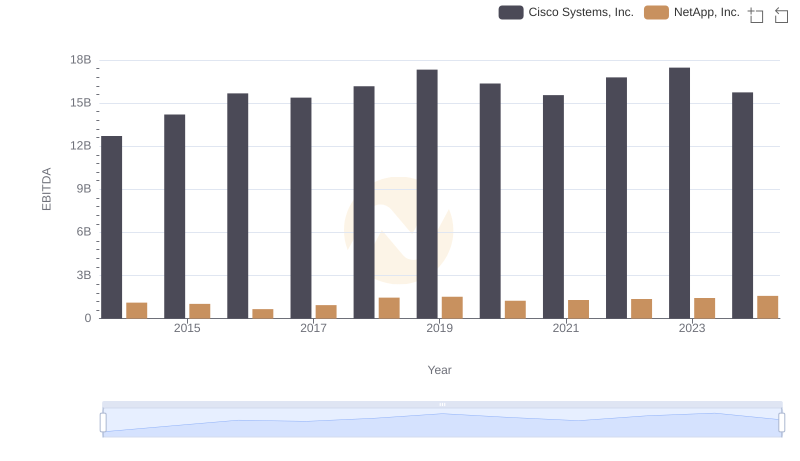
A Side-by-Side Analysis of EBITDA: Cisco Systems, Inc. and NetApp, Inc.