| __timestamp | Cisco Systems, Inc. | Fortive Corporation |
|---|---|---|
| Wednesday, January 1, 2014 | 19373000000 | 3288000000 |
| Thursday, January 1, 2015 | 19480000000 | 3183500000 |
| Friday, January 1, 2016 | 18287000000 | 3191500000 |
| Sunday, January 1, 2017 | 17781000000 | 3357500000 |
| Monday, January 1, 2018 | 18724000000 | 3131400000 |
| Tuesday, January 1, 2019 | 19238000000 | 3639700000 |
| Wednesday, January 1, 2020 | 17618000000 | 2025900000 |
| Friday, January 1, 2021 | 17924000000 | 2247600000 |
| Saturday, January 1, 2022 | 19309000000 | 2462300000 |
| Sunday, January 1, 2023 | 21245000000 | 2471200000 |
| Monday, January 1, 2024 | 18975000000 | 2500800000 |
Igniting the spark of knowledge
In the ever-evolving tech landscape, understanding cost efficiency is crucial. Cisco Systems, Inc. and Fortive Corporation, two industry titans, offer a fascinating study in contrasts. From 2014 to 2023, Cisco's cost of revenue fluctuated, peaking in 2023 with a 10% increase from 2014. Meanwhile, Fortive's cost of revenue saw a 25% decline over the same period, highlighting its strategic cost management.
Cisco's cost efficiency journey reflects its adaptation to market demands, with a notable dip in 2020, likely due to global disruptions. Fortive, on the other hand, consistently reduced costs, showcasing resilience and strategic foresight. The absence of 2024 data for Fortive suggests a potential shift or strategic pivot.
This comparison underscores the importance of cost management in maintaining competitive advantage. As the tech industry continues to evolve, these insights offer valuable lessons for businesses aiming to optimize their revenue strategies.
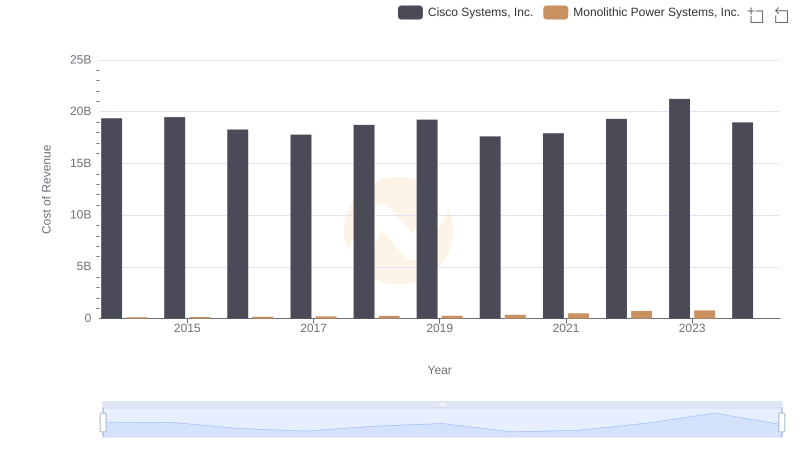
Comparing Cost of Revenue Efficiency: Cisco Systems, Inc. vs Monolithic Power Systems, Inc.
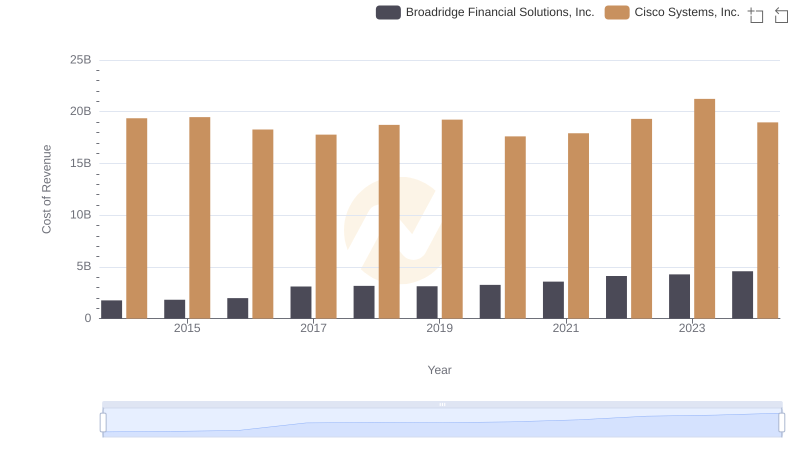
Analyzing Cost of Revenue: Cisco Systems, Inc. and Broadridge Financial Solutions, Inc.
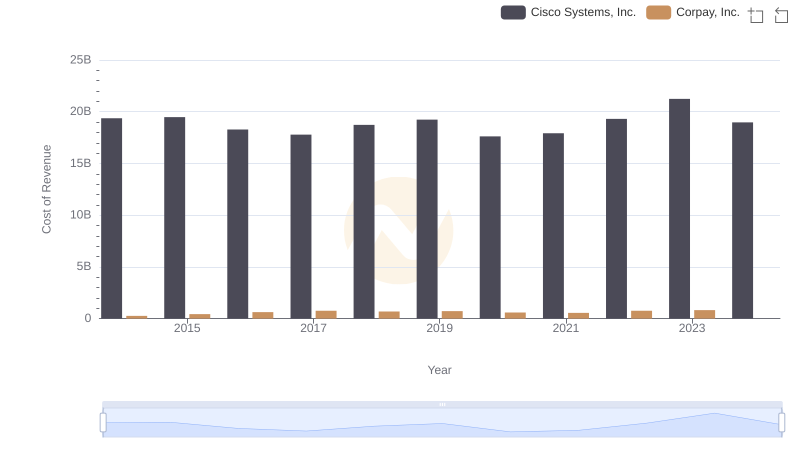
Cost of Revenue Comparison: Cisco Systems, Inc. vs Corpay, Inc.
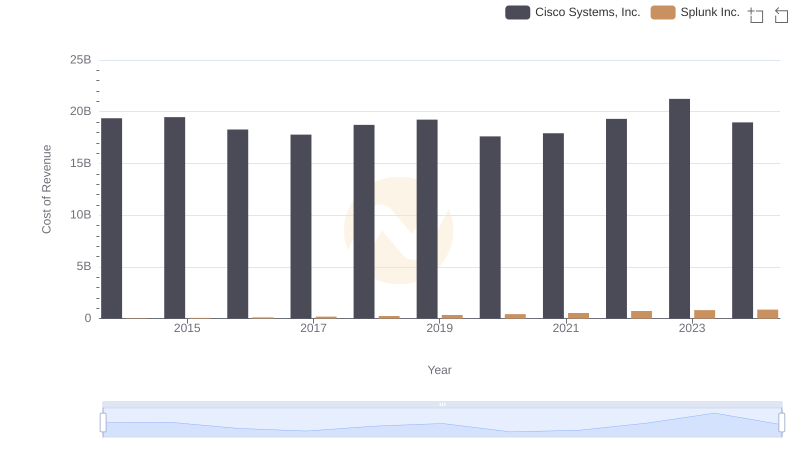
Analyzing Cost of Revenue: Cisco Systems, Inc. and Splunk Inc.
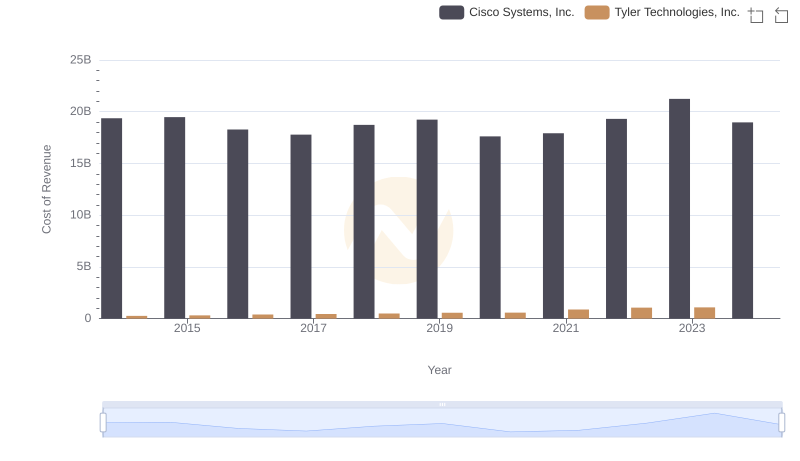
Cost of Revenue Trends: Cisco Systems, Inc. vs Tyler Technologies, Inc.
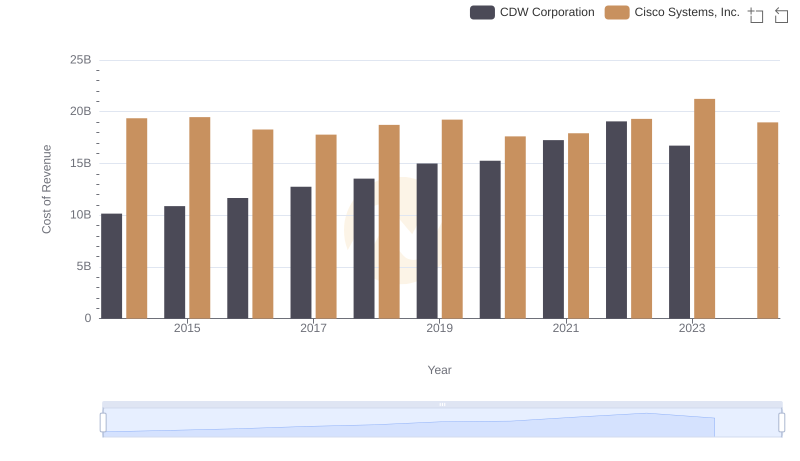
Comparing Cost of Revenue Efficiency: Cisco Systems, Inc. vs CDW Corporation
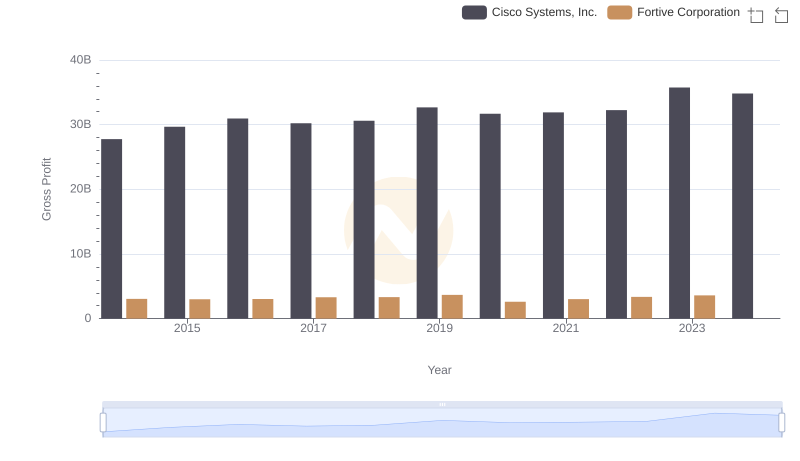
Key Insights on Gross Profit: Cisco Systems, Inc. vs Fortive Corporation
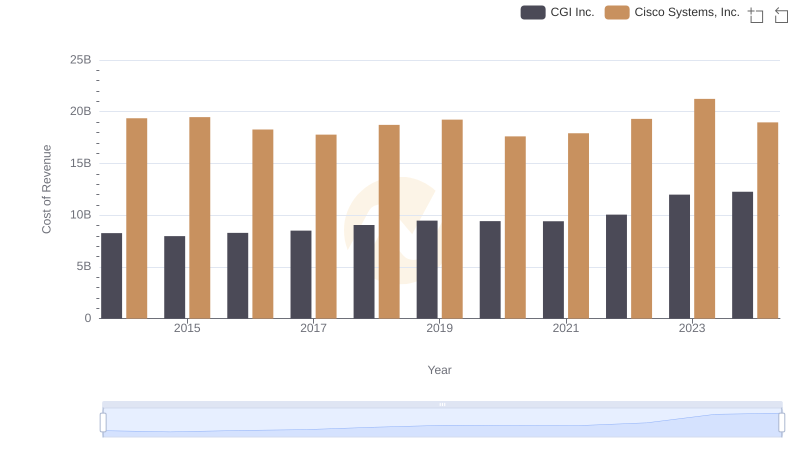
Cisco Systems, Inc. vs CGI Inc.: Efficiency in Cost of Revenue Explored
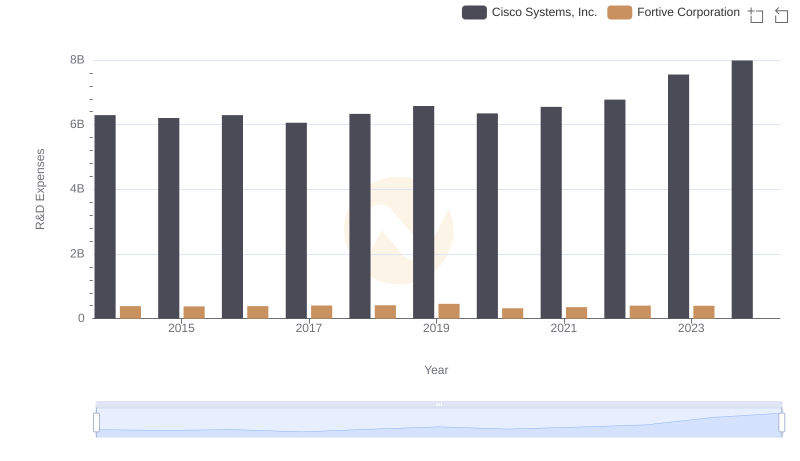
Who Prioritizes Innovation? R&D Spending Compared for Cisco Systems, Inc. and Fortive Corporation
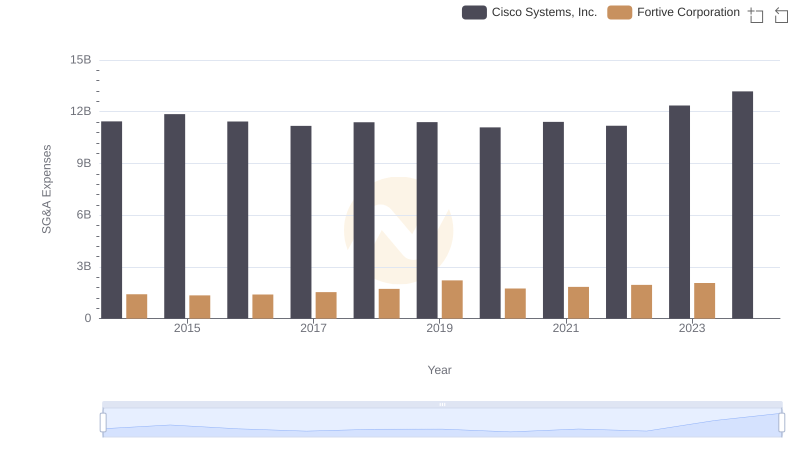
Operational Costs Compared: SG&A Analysis of Cisco Systems, Inc. and Fortive Corporation
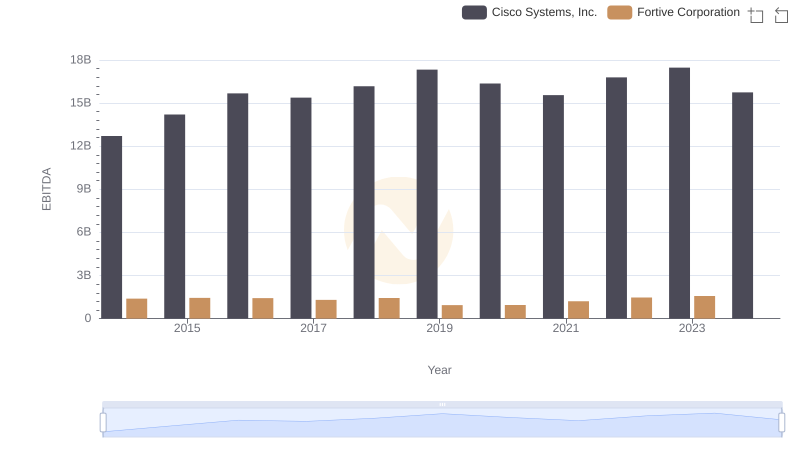
Comprehensive EBITDA Comparison: Cisco Systems, Inc. vs Fortive Corporation