| __timestamp | Cisco Systems, Inc. | Tyler Technologies, Inc. |
|---|---|---|
| Wednesday, January 1, 2014 | 19373000000 | 259730000 |
| Thursday, January 1, 2015 | 19480000000 | 313835000 |
| Friday, January 1, 2016 | 18287000000 | 400692000 |
| Sunday, January 1, 2017 | 17781000000 | 441522000 |
| Monday, January 1, 2018 | 18724000000 | 495704000 |
| Tuesday, January 1, 2019 | 19238000000 | 569527000 |
| Wednesday, January 1, 2020 | 17618000000 | 574151000 |
| Friday, January 1, 2021 | 17924000000 | 882643000 |
| Saturday, January 1, 2022 | 19309000000 | 1066341000 |
| Sunday, January 1, 2023 | 21245000000 | 1090652000 |
| Monday, January 1, 2024 | 18975000000 | 1202042000 |
Unleashing insights
In the ever-evolving landscape of technology, understanding cost dynamics is crucial. Cisco Systems, Inc., a stalwart in networking, and Tyler Technologies, Inc., a leader in public sector software, present a fascinating study in contrasts. From 2014 to 2023, Cisco's cost of revenue has shown a steady trajectory, peaking in 2023 with a 10% increase from 2014. Meanwhile, Tyler Technologies has experienced a remarkable growth, with its cost of revenue surging by over 320% during the same period. This stark difference highlights the diverse strategies and market conditions faced by these companies. While Cisco's costs reflect its expansive global operations, Tyler's rise underscores its aggressive expansion in the public sector. Notably, data for 2024 is incomplete, offering a tantalizing glimpse into future trends. As these giants navigate the complexities of the tech world, their cost strategies will continue to shape their competitive edge.
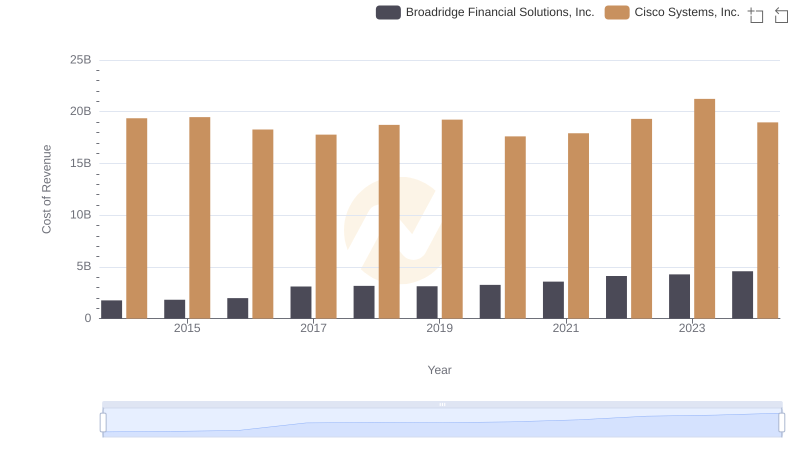
Analyzing Cost of Revenue: Cisco Systems, Inc. and Broadridge Financial Solutions, Inc.
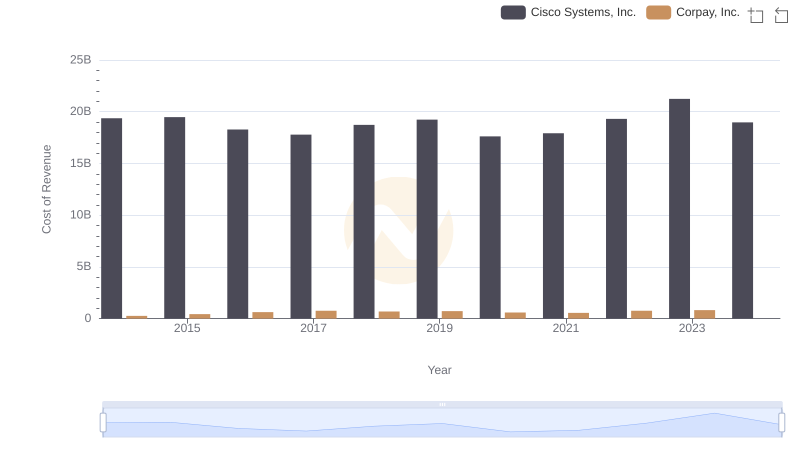
Cost of Revenue Comparison: Cisco Systems, Inc. vs Corpay, Inc.
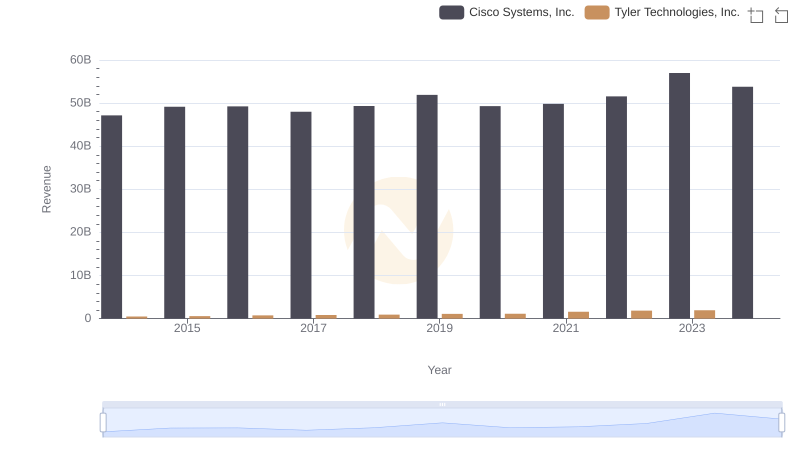
Cisco Systems, Inc. vs Tyler Technologies, Inc.: Annual Revenue Growth Compared
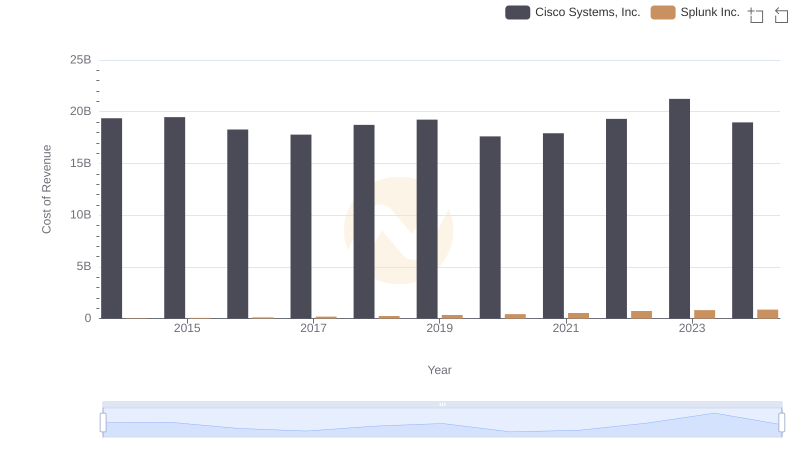
Analyzing Cost of Revenue: Cisco Systems, Inc. and Splunk Inc.
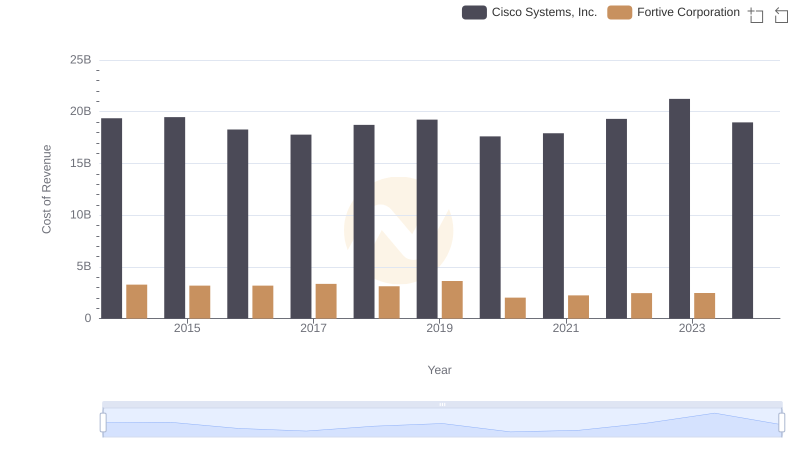
Comparing Cost of Revenue Efficiency: Cisco Systems, Inc. vs Fortive Corporation
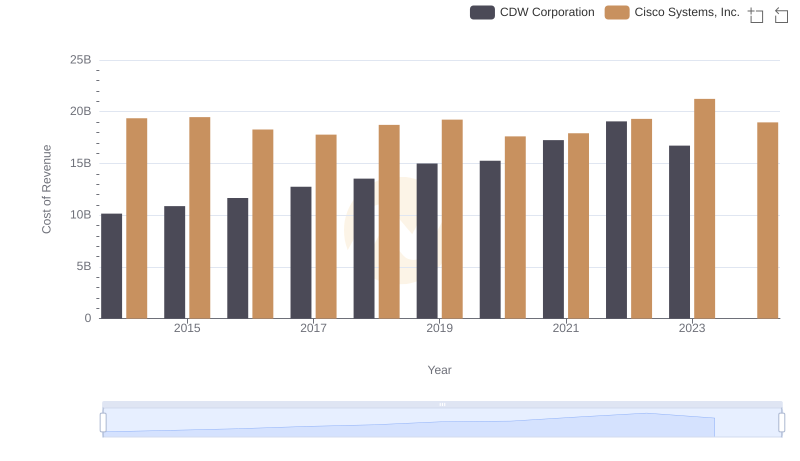
Comparing Cost of Revenue Efficiency: Cisco Systems, Inc. vs CDW Corporation
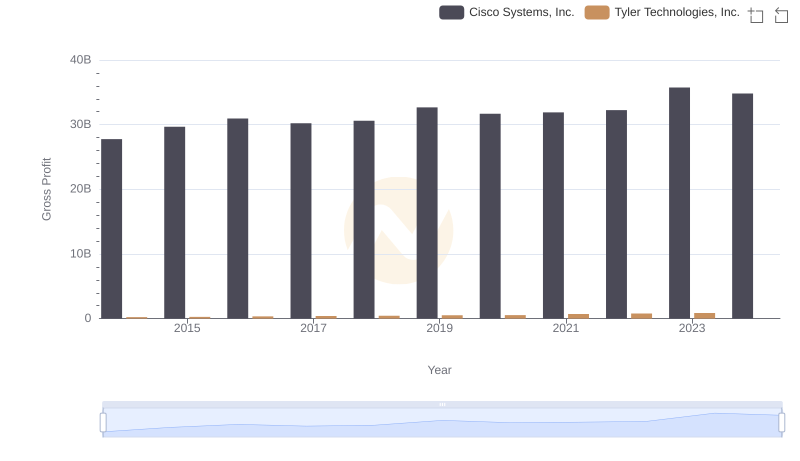
Gross Profit Analysis: Comparing Cisco Systems, Inc. and Tyler Technologies, Inc.
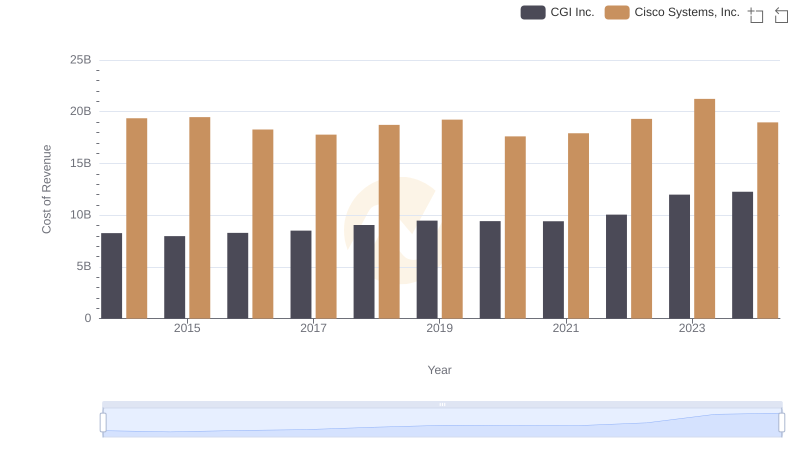
Cisco Systems, Inc. vs CGI Inc.: Efficiency in Cost of Revenue Explored
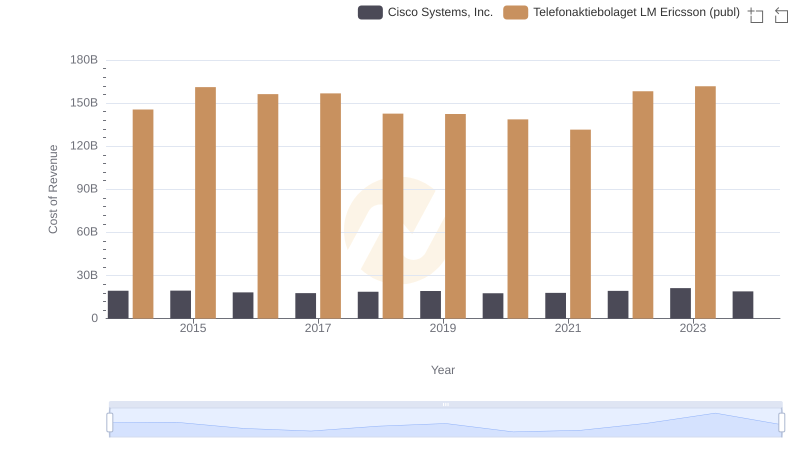
Cost of Revenue: Key Insights for Cisco Systems, Inc. and Telefonaktiebolaget LM Ericsson (publ)
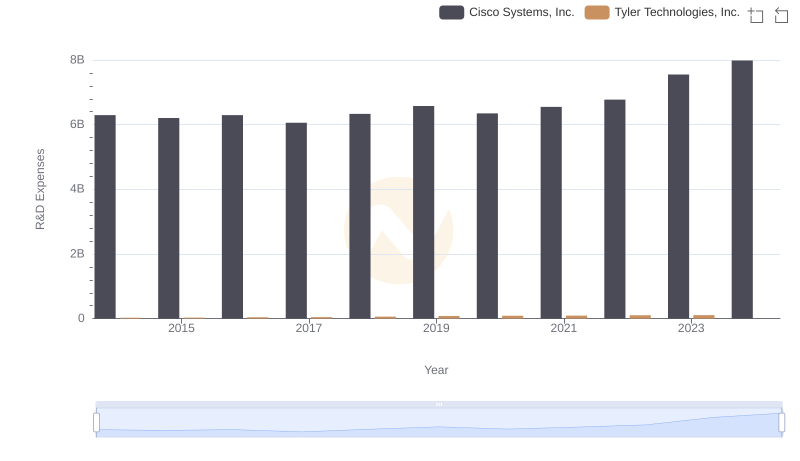
Analyzing R&D Budgets: Cisco Systems, Inc. vs Tyler Technologies, Inc.
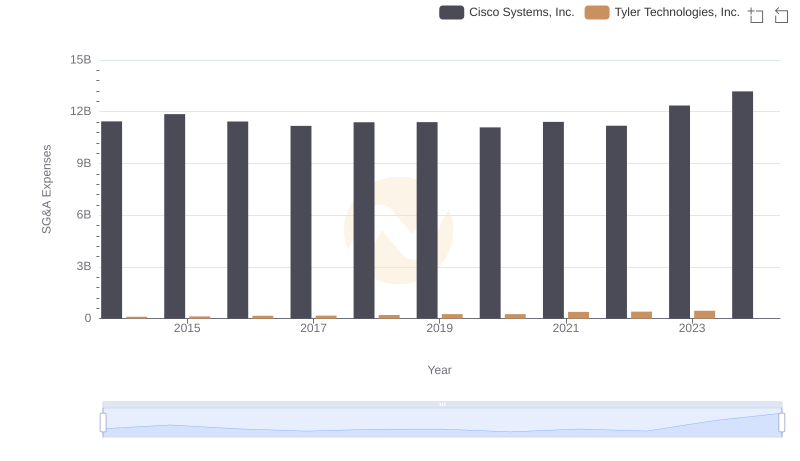
Breaking Down SG&A Expenses: Cisco Systems, Inc. vs Tyler Technologies, Inc.
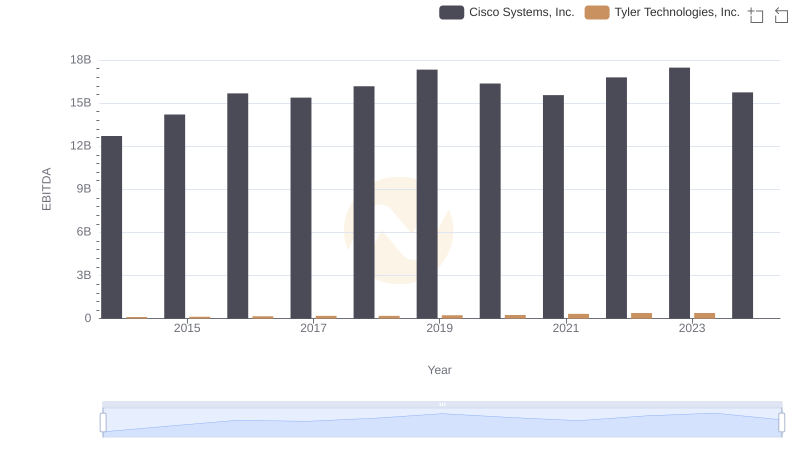
EBITDA Performance Review: Cisco Systems, Inc. vs Tyler Technologies, Inc.