| __timestamp | CGI Inc. | Cisco Systems, Inc. |
|---|---|---|
| Wednesday, January 1, 2014 | 8263306000 | 19373000000 |
| Thursday, January 1, 2015 | 7980185000 | 19480000000 |
| Friday, January 1, 2016 | 8293407000 | 18287000000 |
| Sunday, January 1, 2017 | 8500825000 | 17781000000 |
| Monday, January 1, 2018 | 9045660000 | 18724000000 |
| Tuesday, January 1, 2019 | 9471661000 | 19238000000 |
| Wednesday, January 1, 2020 | 9420400000 | 17618000000 |
| Friday, January 1, 2021 | 9409971000 | 17924000000 |
| Saturday, January 1, 2022 | 10048149000 | 19309000000 |
| Sunday, January 1, 2023 | 11982421000 | 21245000000 |
| Monday, January 1, 2024 | 12259730000 | 18975000000 |
In pursuit of knowledge
In the ever-evolving tech industry, cost efficiency is a critical metric for success. This analysis delves into the cost of revenue trends for Cisco Systems, Inc. and CGI Inc. from 2014 to 2024. Over this decade, Cisco's cost of revenue has shown a slight decline, with a notable dip in 2020, while CGI Inc. has experienced a steady increase, peaking in 2024. Cisco's cost of revenue decreased by approximately 2% from 2014 to 2024, whereas CGI Inc. saw a rise of about 48% in the same period. This divergence highlights Cisco's focus on optimizing operational efficiency, while CGI Inc. appears to be investing more in its revenue-generating activities. As the tech landscape continues to shift, these trends offer valuable insights into the strategic priorities of these industry giants.

Analyzing Cost of Revenue: Cisco Systems, Inc. and Splunk Inc.
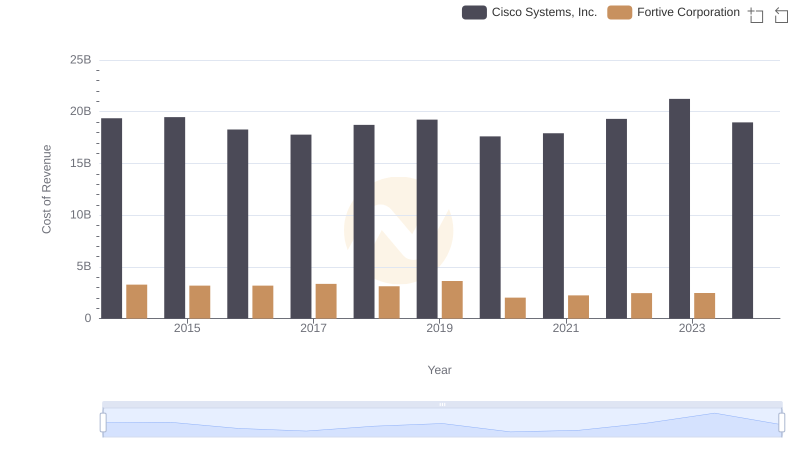
Comparing Cost of Revenue Efficiency: Cisco Systems, Inc. vs Fortive Corporation
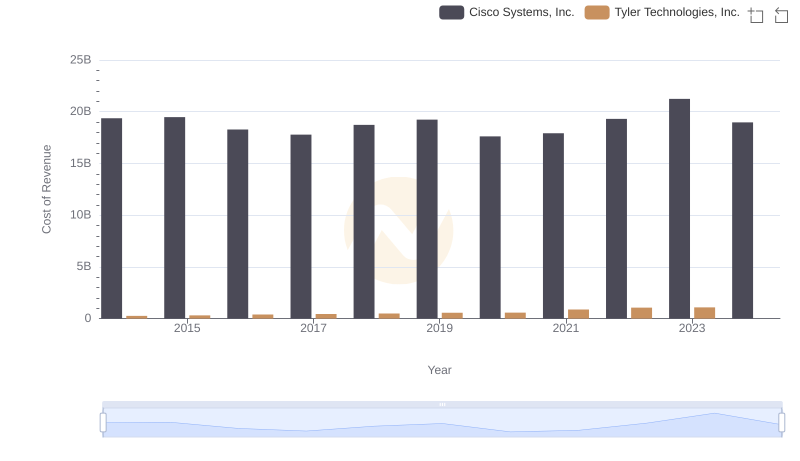
Cost of Revenue Trends: Cisco Systems, Inc. vs Tyler Technologies, Inc.
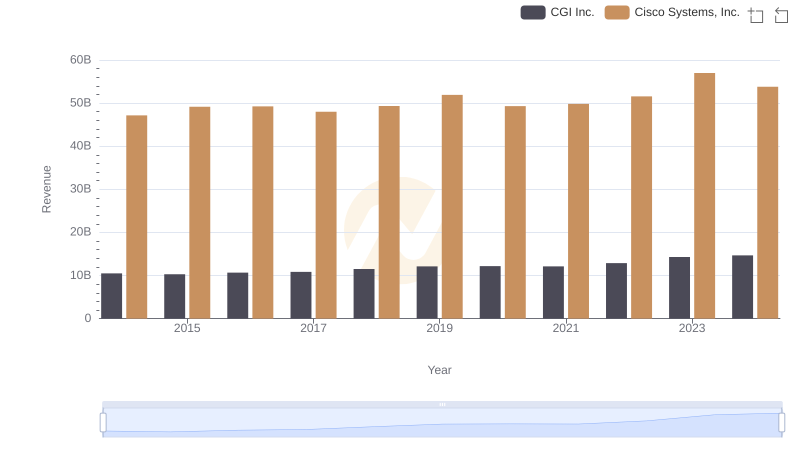
Revenue Insights: Cisco Systems, Inc. and CGI Inc. Performance Compared
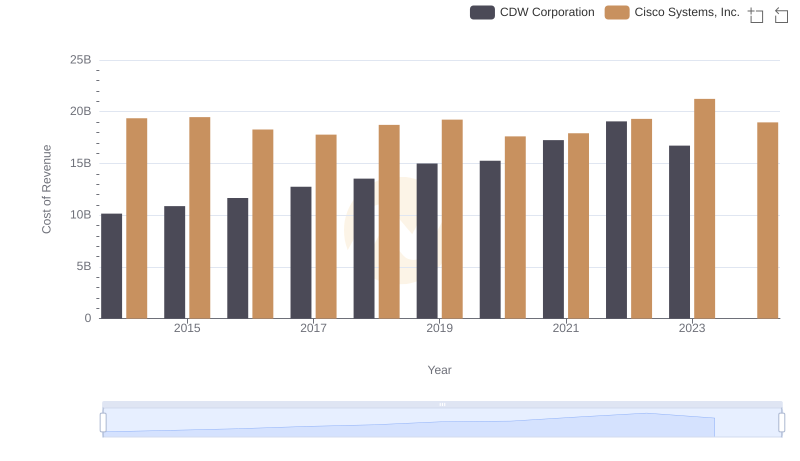
Comparing Cost of Revenue Efficiency: Cisco Systems, Inc. vs CDW Corporation
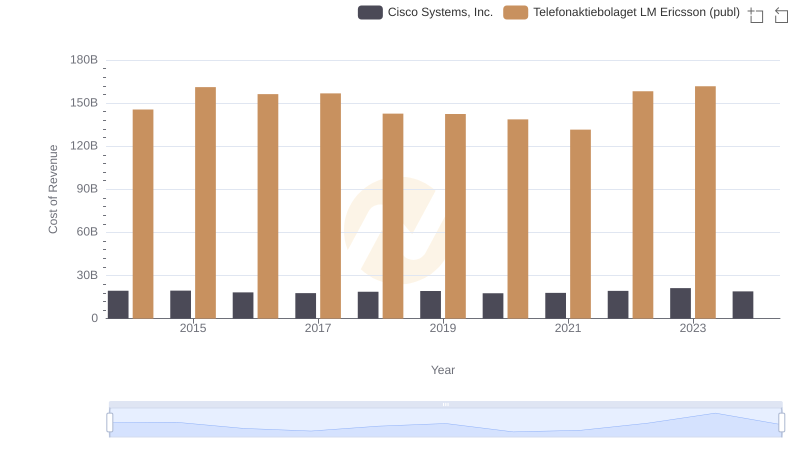
Cost of Revenue: Key Insights for Cisco Systems, Inc. and Telefonaktiebolaget LM Ericsson (publ)
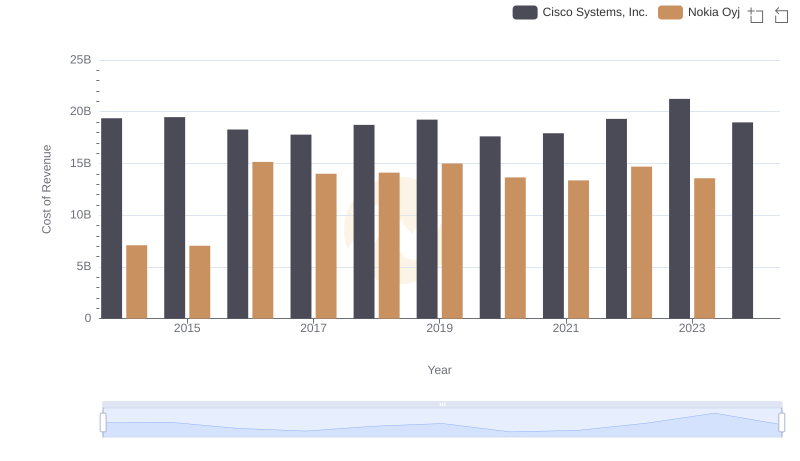
Cost Insights: Breaking Down Cisco Systems, Inc. and Nokia Oyj's Expenses
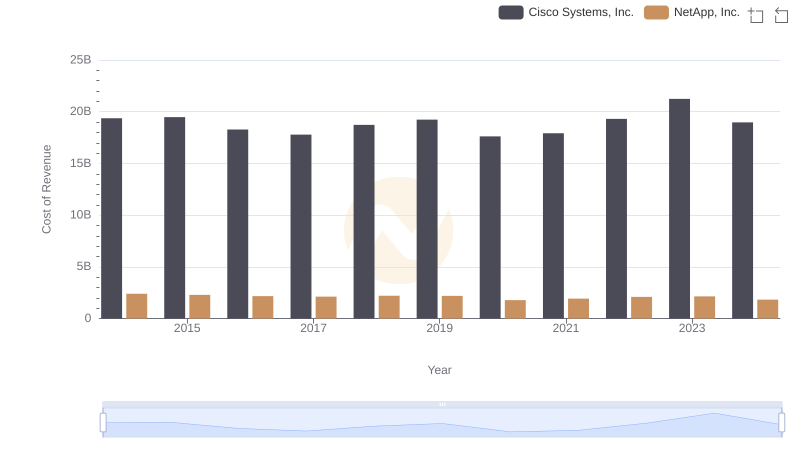
Comparing Cost of Revenue Efficiency: Cisco Systems, Inc. vs NetApp, Inc.
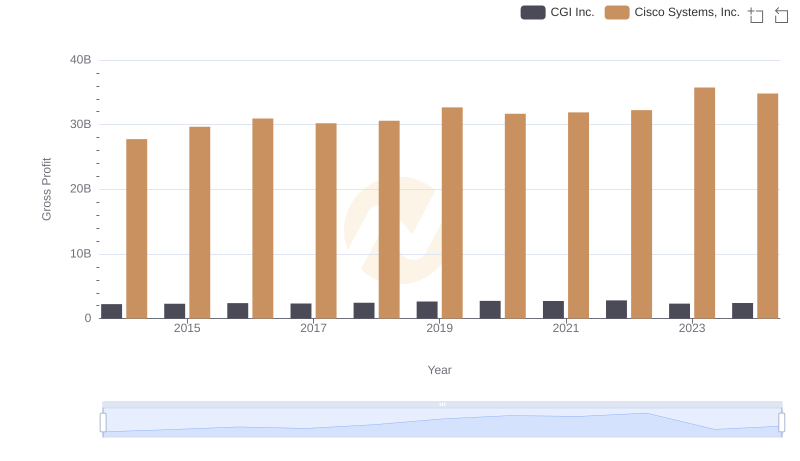
Key Insights on Gross Profit: Cisco Systems, Inc. vs CGI Inc.
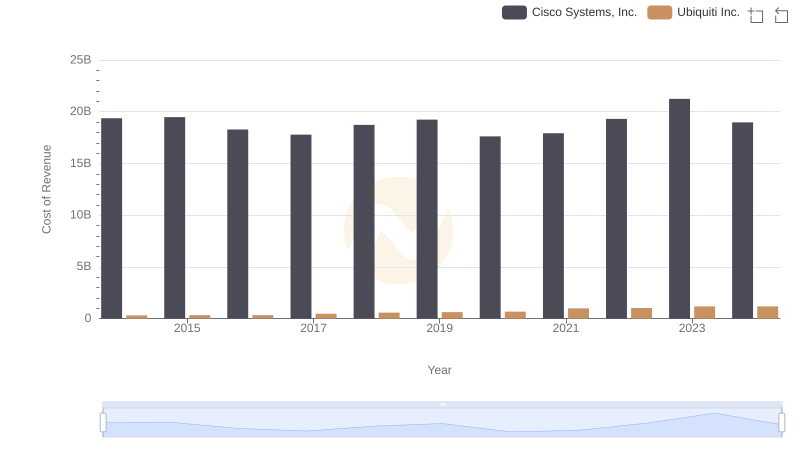
Cost of Revenue Trends: Cisco Systems, Inc. vs Ubiquiti Inc.
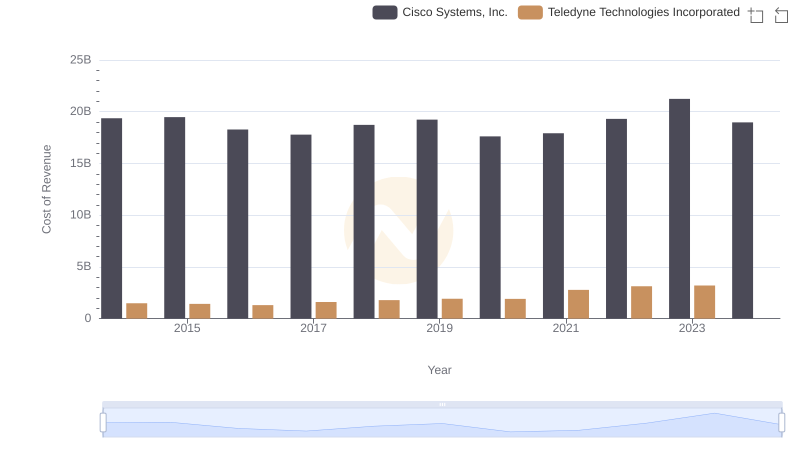
Cost of Revenue Comparison: Cisco Systems, Inc. vs Teledyne Technologies Incorporated
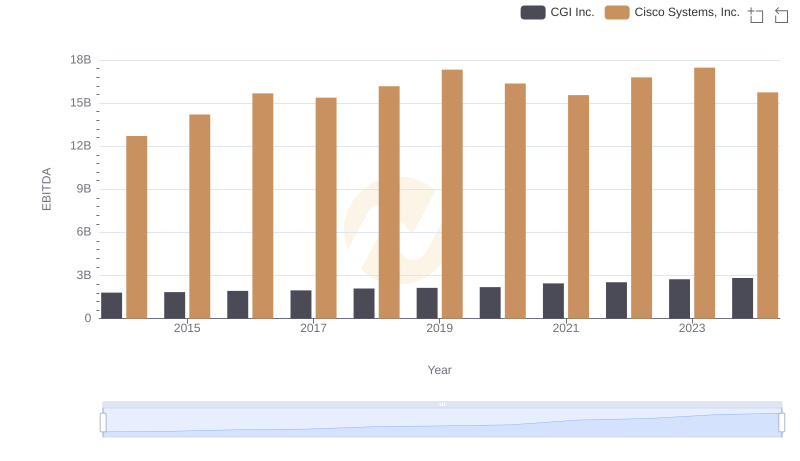
EBITDA Analysis: Evaluating Cisco Systems, Inc. Against CGI Inc.