| __timestamp | Cisco Systems, Inc. | Corpay, Inc. |
|---|---|---|
| Wednesday, January 1, 2014 | 19373000000 | 269591000 |
| Thursday, January 1, 2015 | 19480000000 | 439330000 |
| Friday, January 1, 2016 | 18287000000 | 621965000 |
| Sunday, January 1, 2017 | 17781000000 | 756337000 |
| Monday, January 1, 2018 | 18724000000 | 692584000 |
| Tuesday, January 1, 2019 | 19238000000 | 726044000 |
| Wednesday, January 1, 2020 | 17618000000 | 596363000 |
| Friday, January 1, 2021 | 17924000000 | 559819000 |
| Saturday, January 1, 2022 | 19309000000 | 764707000 |
| Sunday, January 1, 2023 | 21245000000 | 819908000 |
| Monday, January 1, 2024 | 18975000000 | 0 |
Igniting the spark of knowledge
In the ever-evolving landscape of technology and finance, Cisco Systems, Inc. and Corpay, Inc. stand as titans in their respective fields. Over the past decade, Cisco's cost of revenue has shown a steady trend, peaking in 2023 with a 10% increase from 2014. Meanwhile, Corpay's cost of revenue has seen a remarkable growth, surging by over 200% from 2014 to 2023. This stark contrast highlights the dynamic nature of these industries, with Cisco maintaining a robust yet stable trajectory, while Corpay experiences rapid expansion. Notably, data for Corpay in 2024 is missing, leaving room for speculation on its future performance. As we delve into these figures, it becomes evident that understanding cost structures is crucial for investors and stakeholders aiming to navigate the complexities of these markets.
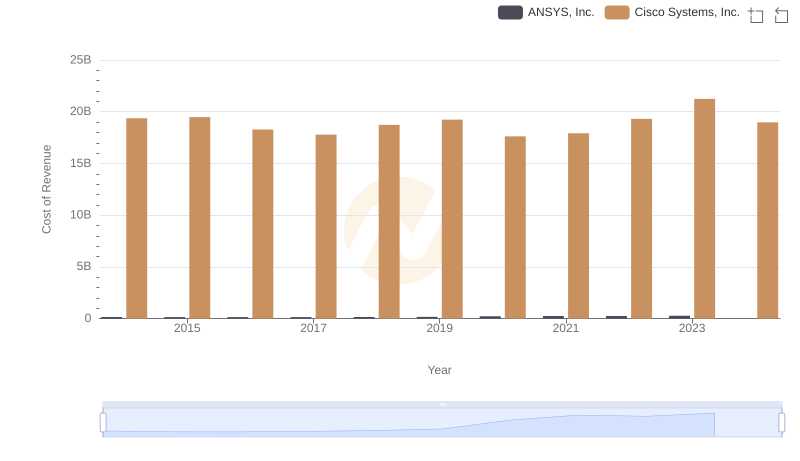
Cost of Revenue Trends: Cisco Systems, Inc. vs ANSYS, Inc.
Cost Insights: Breaking Down Cisco Systems, Inc. and II-VI Incorporated's Expenses
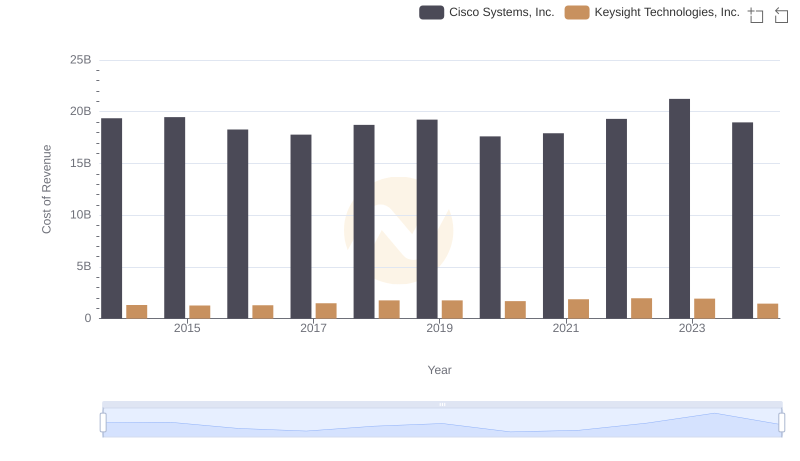
Cisco Systems, Inc. vs Keysight Technologies, Inc.: Efficiency in Cost of Revenue Explored
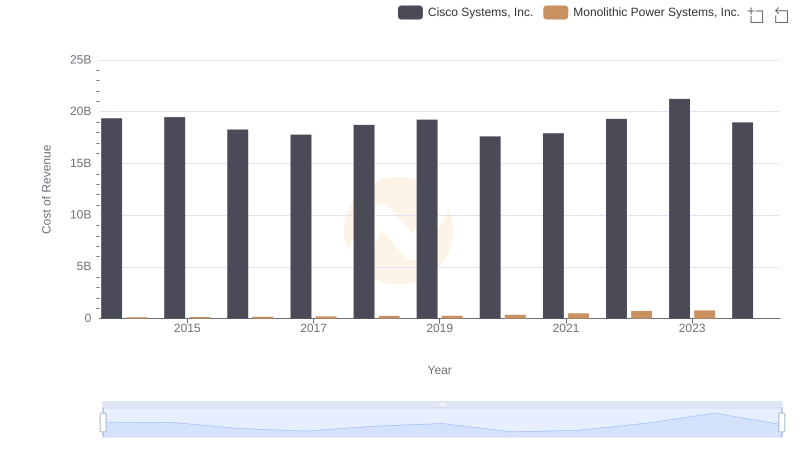
Comparing Cost of Revenue Efficiency: Cisco Systems, Inc. vs Monolithic Power Systems, Inc.
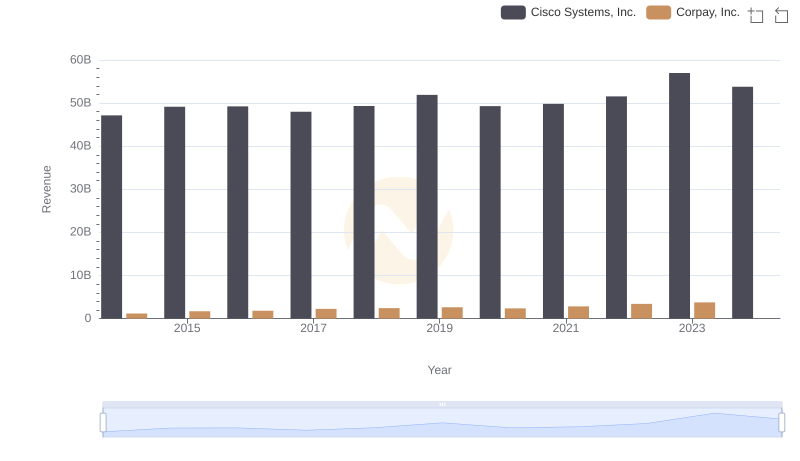
Revenue Showdown: Cisco Systems, Inc. vs Corpay, Inc.
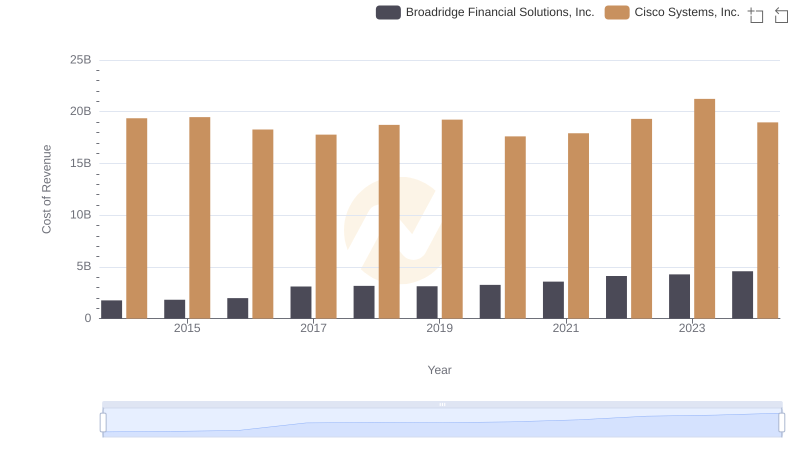
Analyzing Cost of Revenue: Cisco Systems, Inc. and Broadridge Financial Solutions, Inc.
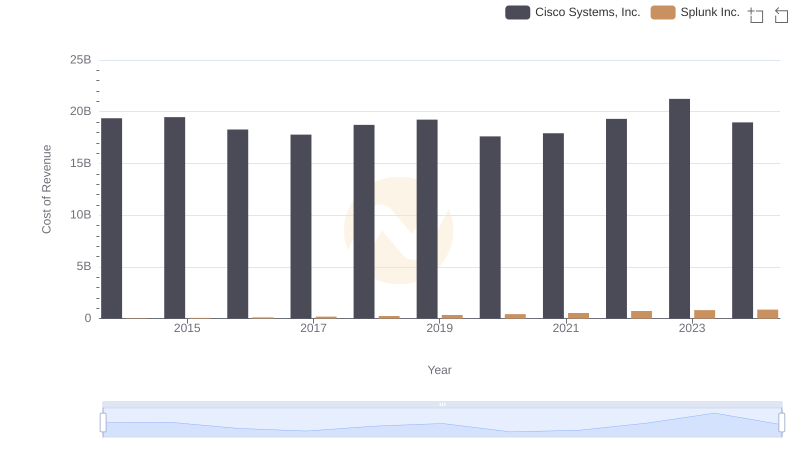
Analyzing Cost of Revenue: Cisco Systems, Inc. and Splunk Inc.
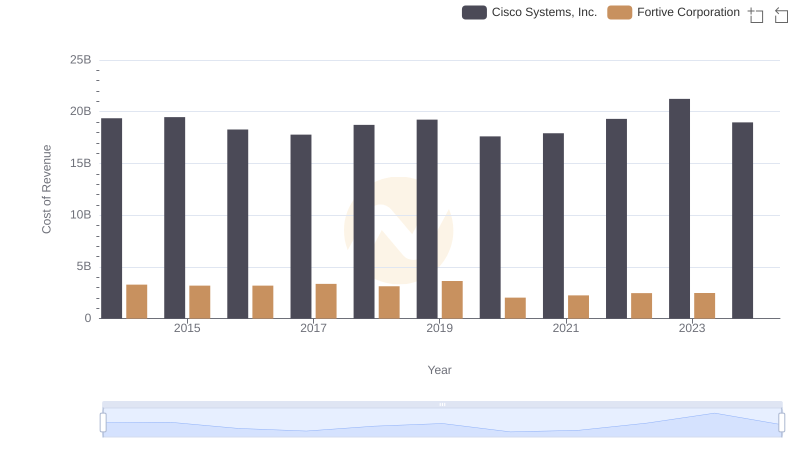
Comparing Cost of Revenue Efficiency: Cisco Systems, Inc. vs Fortive Corporation
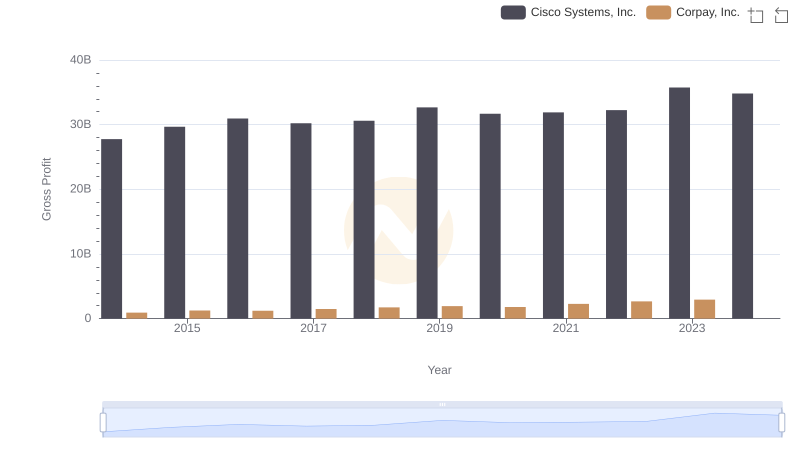
Gross Profit Comparison: Cisco Systems, Inc. and Corpay, Inc. Trends
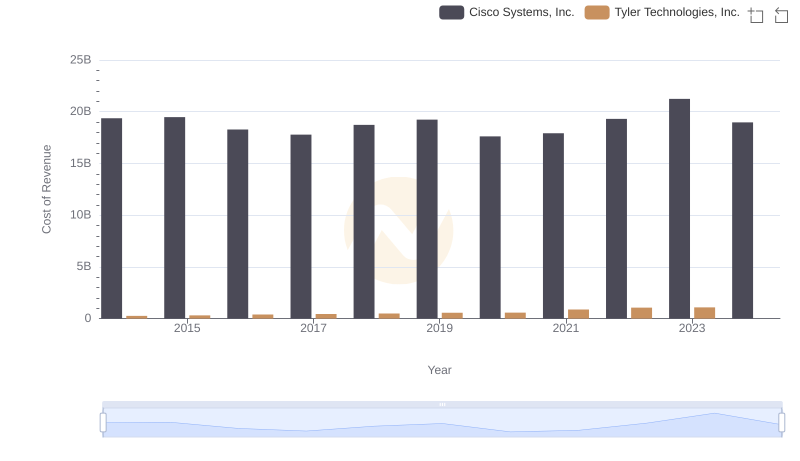
Cost of Revenue Trends: Cisco Systems, Inc. vs Tyler Technologies, Inc.
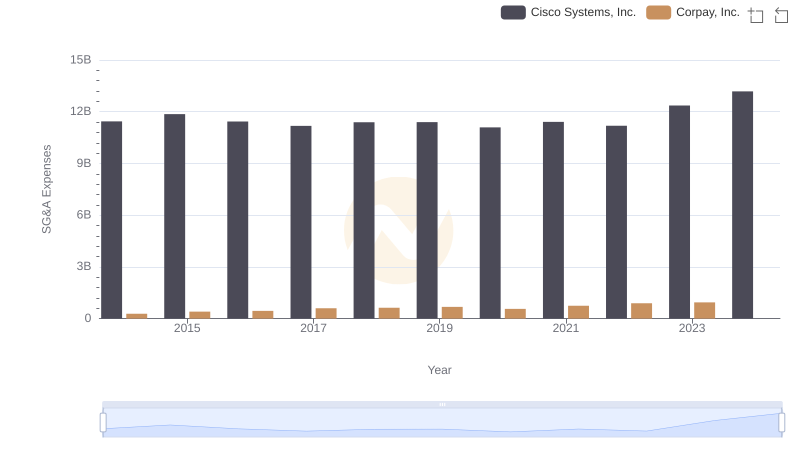
Cisco Systems, Inc. and Corpay, Inc.: SG&A Spending Patterns Compared
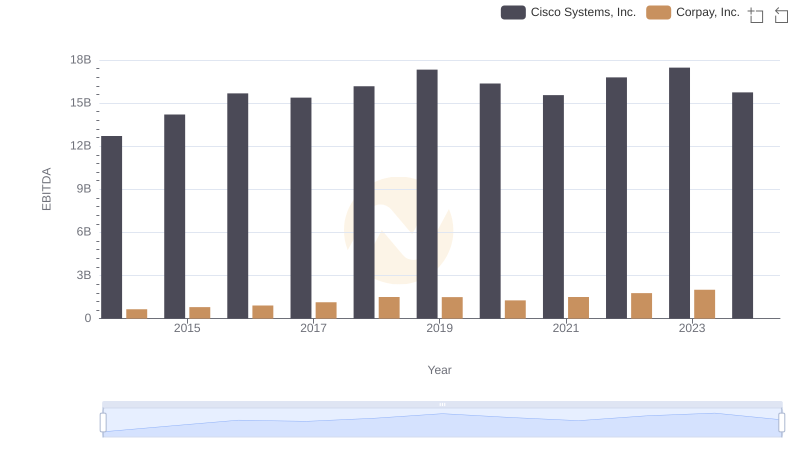
EBITDA Metrics Evaluated: Cisco Systems, Inc. vs Corpay, Inc.