| __timestamp | Cisco Systems, Inc. | Nokia Oyj |
|---|---|---|
| Wednesday, January 1, 2014 | 19373000000 | 7094000000 |
| Thursday, January 1, 2015 | 19480000000 | 7045000000 |
| Friday, January 1, 2016 | 18287000000 | 15157000000 |
| Sunday, January 1, 2017 | 17781000000 | 14009000000 |
| Monday, January 1, 2018 | 18724000000 | 14117000000 |
| Tuesday, January 1, 2019 | 19238000000 | 14989000000 |
| Wednesday, January 1, 2020 | 17618000000 | 13653000000 |
| Friday, January 1, 2021 | 17924000000 | 13368000000 |
| Saturday, January 1, 2022 | 19309000000 | 14689000000 |
| Sunday, January 1, 2023 | 21245000000 | 13571000000 |
| Monday, January 1, 2024 | 18975000000 |
Infusing magic into the data realm
In the ever-evolving tech landscape, understanding cost structures is crucial for investors and analysts. This chart provides a decade-long view of the cost of revenue for two industry giants: Cisco Systems, Inc. and Nokia Oyj, from 2014 to 2023. Cisco's cost of revenue has shown a steady trend, peaking in 2023 with a 10% increase from 2014. In contrast, Nokia's costs have fluctuated, with a notable 115% surge in 2016, reflecting strategic shifts and market challenges. Interestingly, Nokia's data for 2024 is missing, hinting at potential reporting changes or strategic pivots. This comparative analysis not only highlights the financial strategies of these tech titans but also offers insights into their operational efficiencies. As the tech industry continues to grow, keeping an eye on such cost trends can provide valuable foresight into future market dynamics.
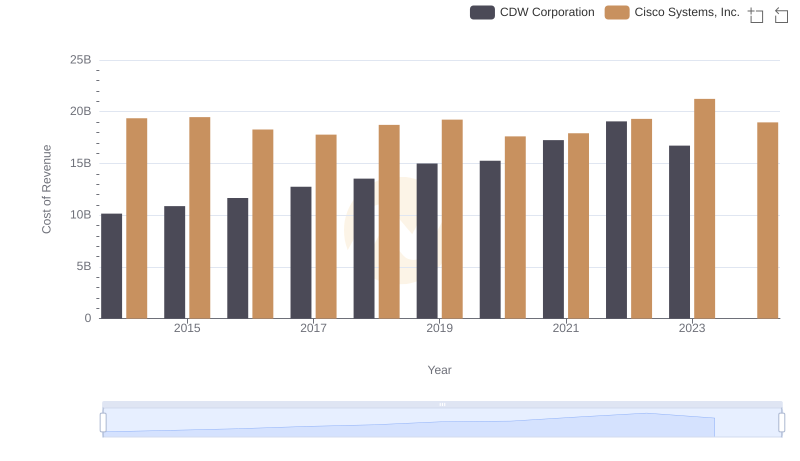
Comparing Cost of Revenue Efficiency: Cisco Systems, Inc. vs CDW Corporation
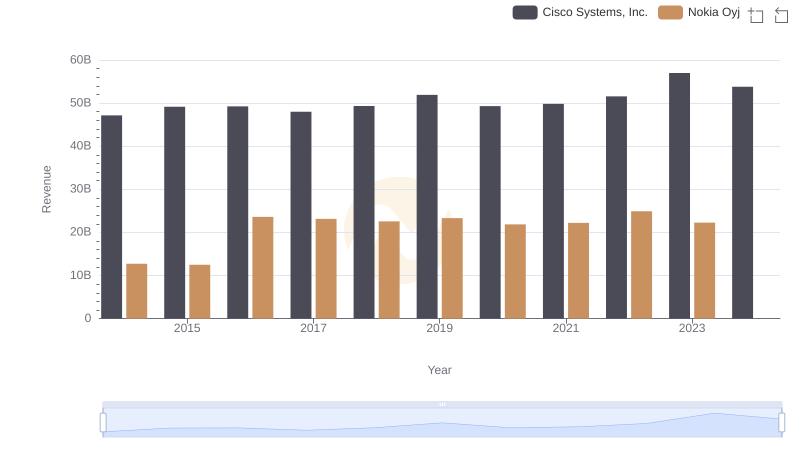
Cisco Systems, Inc. vs Nokia Oyj: Examining Key Revenue Metrics
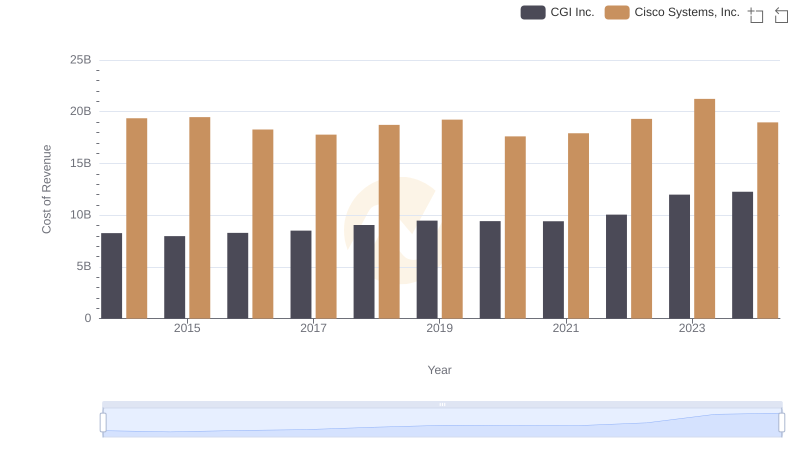
Cisco Systems, Inc. vs CGI Inc.: Efficiency in Cost of Revenue Explored
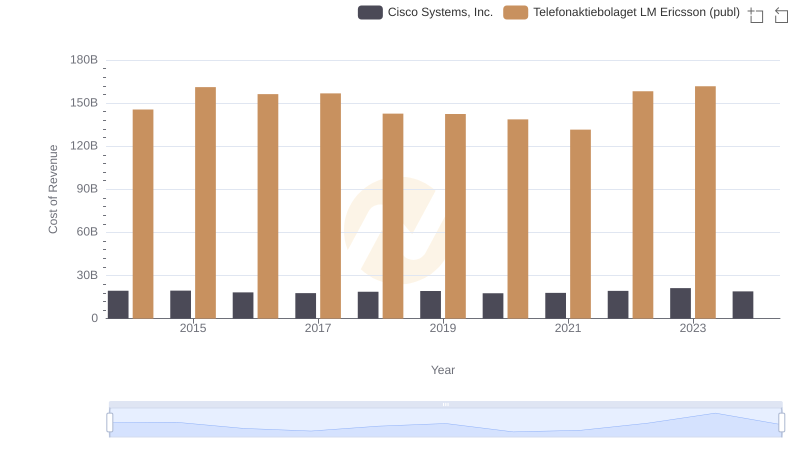
Cost of Revenue: Key Insights for Cisco Systems, Inc. and Telefonaktiebolaget LM Ericsson (publ)
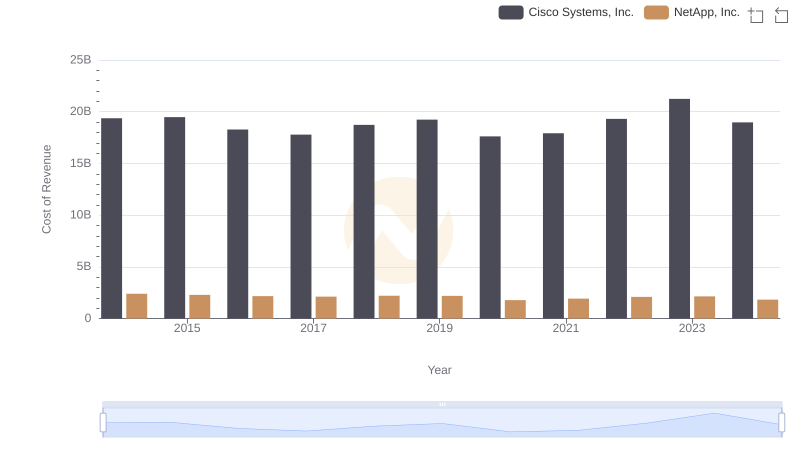
Comparing Cost of Revenue Efficiency: Cisco Systems, Inc. vs NetApp, Inc.
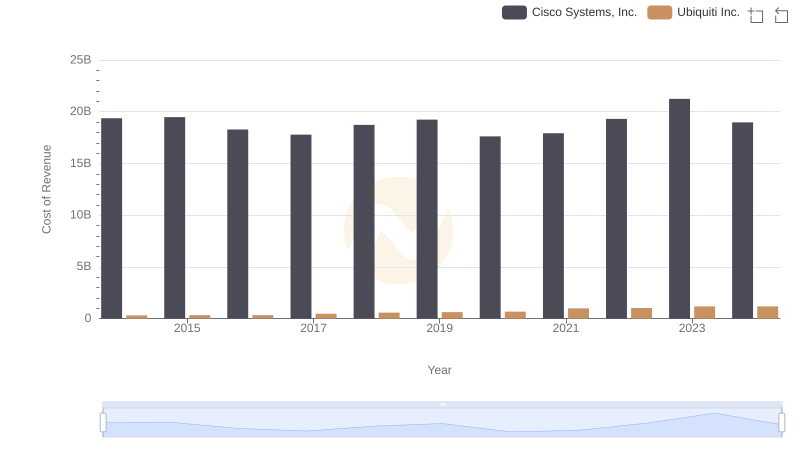
Cost of Revenue Trends: Cisco Systems, Inc. vs Ubiquiti Inc.
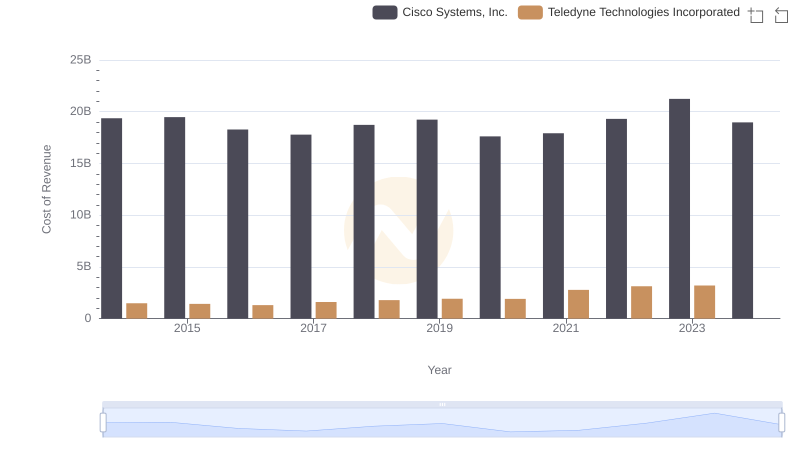
Cost of Revenue Comparison: Cisco Systems, Inc. vs Teledyne Technologies Incorporated
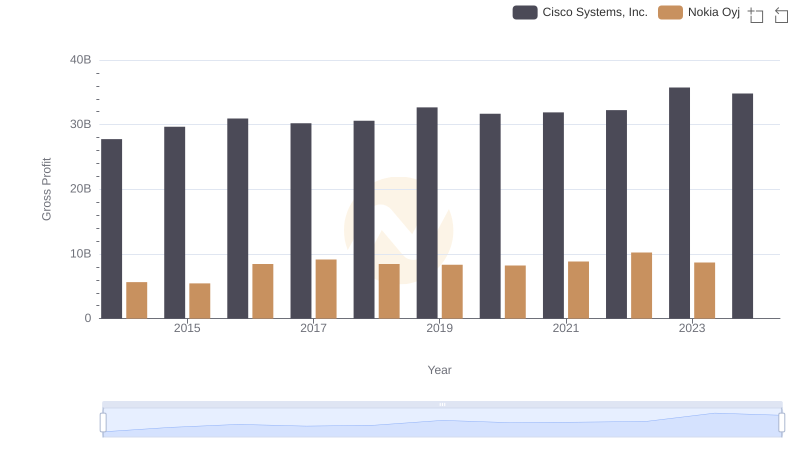
Gross Profit Comparison: Cisco Systems, Inc. and Nokia Oyj Trends
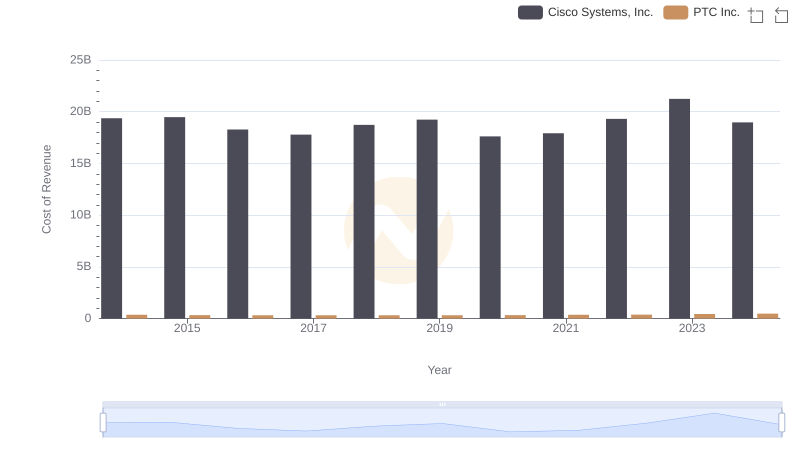
Cost Insights: Breaking Down Cisco Systems, Inc. and PTC Inc.'s Expenses
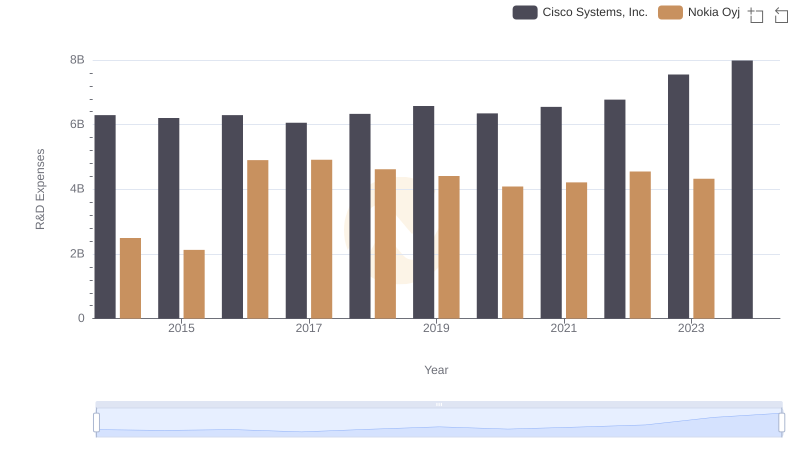
Research and Development: Comparing Key Metrics for Cisco Systems, Inc. and Nokia Oyj
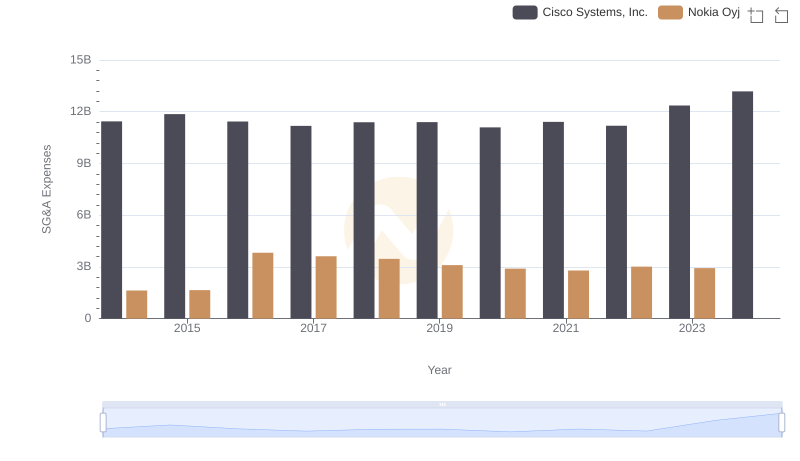
Cisco Systems, Inc. or Nokia Oyj: Who Manages SG&A Costs Better?
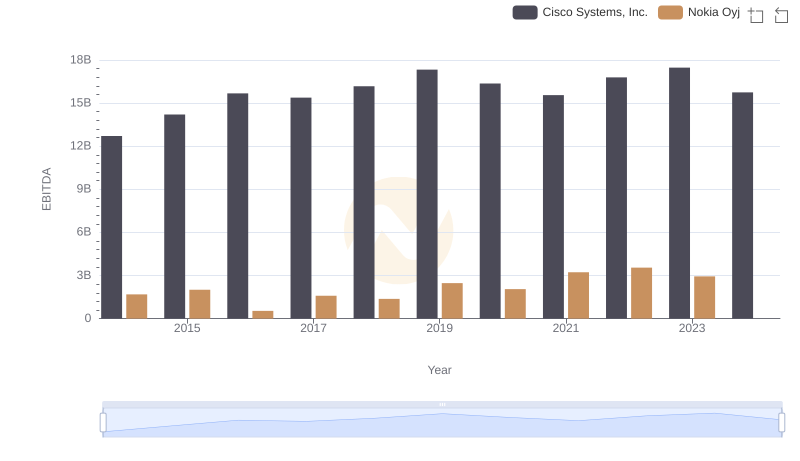
Professional EBITDA Benchmarking: Cisco Systems, Inc. vs Nokia Oyj