| __timestamp | Cisco Systems, Inc. | Telefonaktiebolaget LM Ericsson (publ) |
|---|---|---|
| Wednesday, January 1, 2014 | 19373000000 | 145556000000 |
| Thursday, January 1, 2015 | 19480000000 | 161101000000 |
| Friday, January 1, 2016 | 18287000000 | 156243000000 |
| Sunday, January 1, 2017 | 17781000000 | 156758000000 |
| Monday, January 1, 2018 | 18724000000 | 142638000000 |
| Tuesday, January 1, 2019 | 19238000000 | 142392000000 |
| Wednesday, January 1, 2020 | 17618000000 | 138666000000 |
| Friday, January 1, 2021 | 17924000000 | 131565000000 |
| Saturday, January 1, 2022 | 19309000000 | 158251000000 |
| Sunday, January 1, 2023 | 21245000000 | 161749000000 |
| Monday, January 1, 2024 | 18975000000 |
Unleashing the power of data
In the ever-evolving landscape of telecommunications and networking, understanding the cost of revenue is crucial for evaluating company performance. Cisco Systems, Inc. and Telefonaktiebolaget LM Ericsson (publ) have been industry leaders, each with unique strategies and market dynamics. From 2014 to 2023, Cisco's cost of revenue fluctuated, peaking in 2023 with a 10% increase from 2022. Meanwhile, Ericsson's cost of revenue showed a more volatile trend, with a notable 23% drop from 2015 to 2021, before rebounding by 24% in 2023. This data highlights the contrasting operational efficiencies and market challenges faced by these giants. Notably, the absence of data for Ericsson in 2024 suggests potential reporting delays or strategic shifts. As the industry continues to innovate, these insights provide a window into the financial health and strategic priorities of two of the world's leading tech companies.
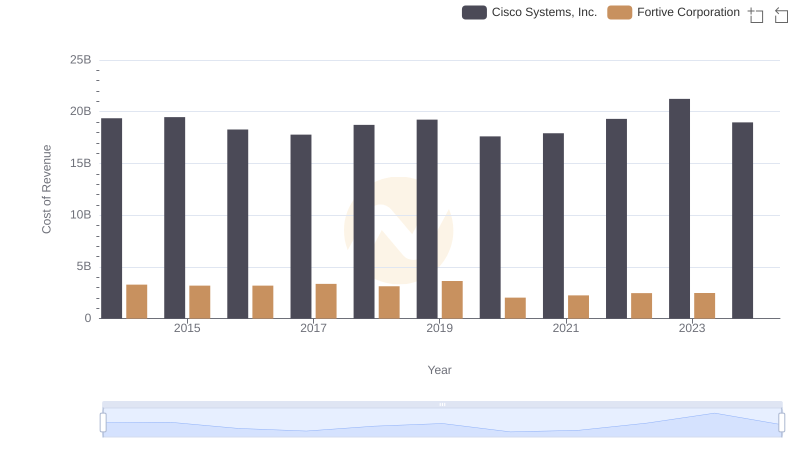
Comparing Cost of Revenue Efficiency: Cisco Systems, Inc. vs Fortive Corporation
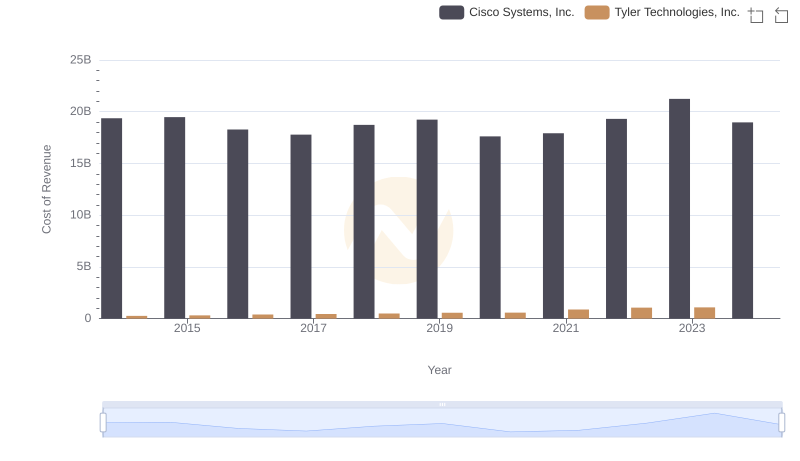
Cost of Revenue Trends: Cisco Systems, Inc. vs Tyler Technologies, Inc.

Cisco Systems, Inc. vs Telefonaktiebolaget LM Ericsson (publ): Examining Key Revenue Metrics
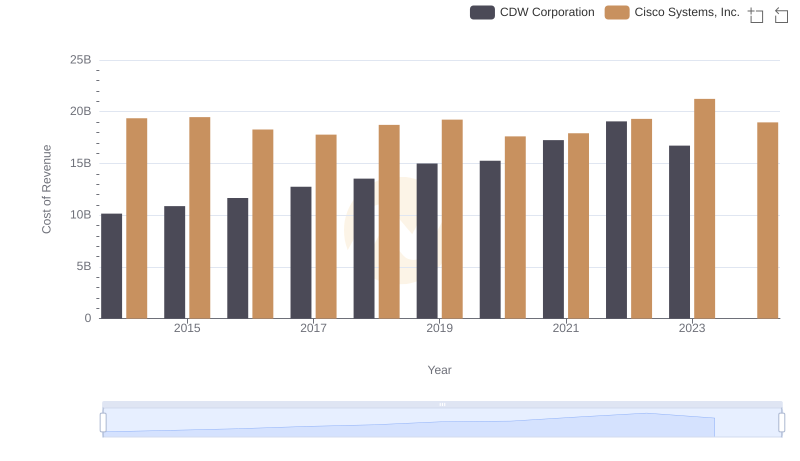
Comparing Cost of Revenue Efficiency: Cisco Systems, Inc. vs CDW Corporation
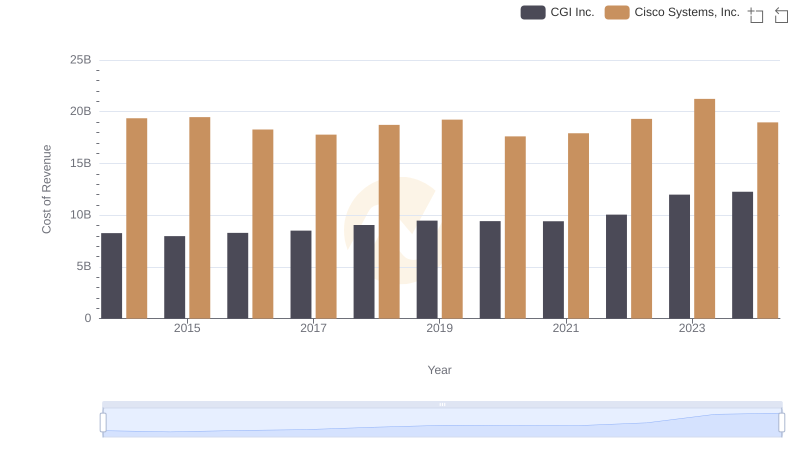
Cisco Systems, Inc. vs CGI Inc.: Efficiency in Cost of Revenue Explored
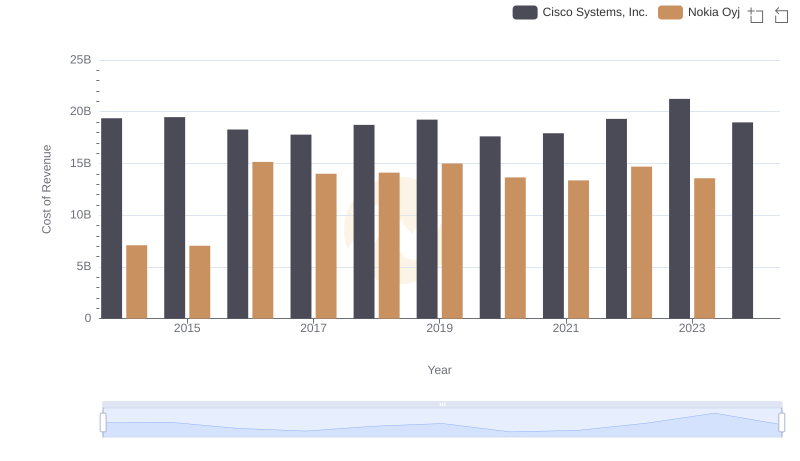
Cost Insights: Breaking Down Cisco Systems, Inc. and Nokia Oyj's Expenses
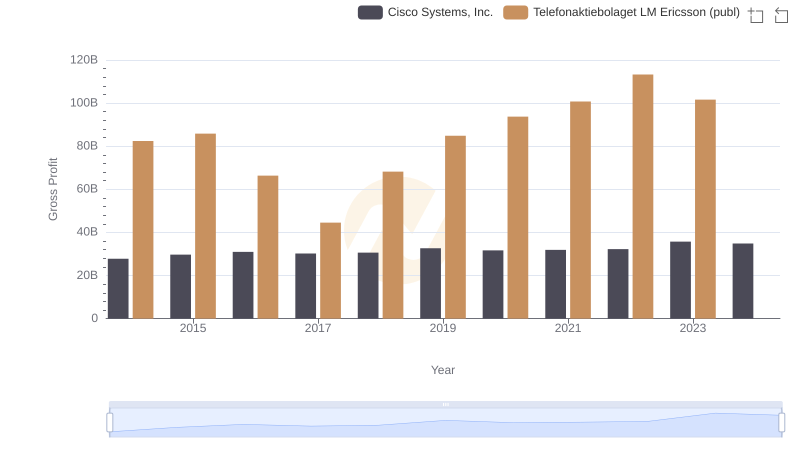
Cisco Systems, Inc. vs Telefonaktiebolaget LM Ericsson (publ): A Gross Profit Performance Breakdown
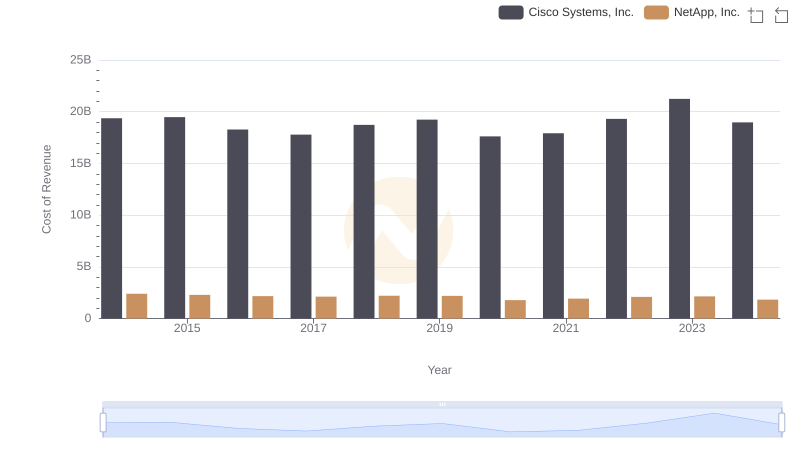
Comparing Cost of Revenue Efficiency: Cisco Systems, Inc. vs NetApp, Inc.
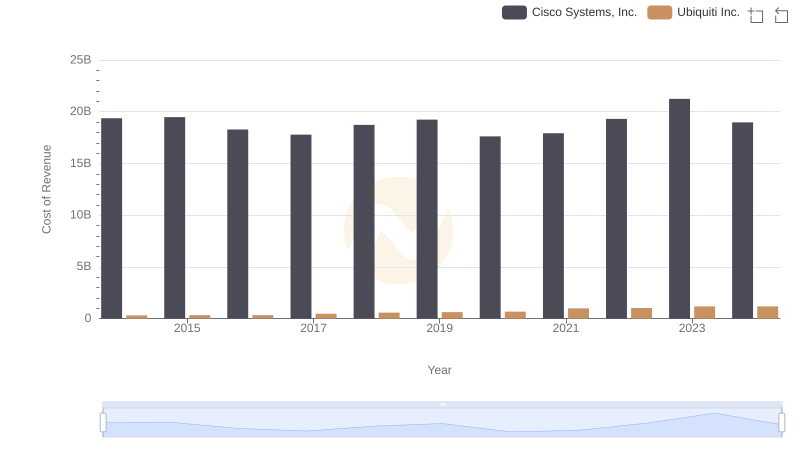
Cost of Revenue Trends: Cisco Systems, Inc. vs Ubiquiti Inc.
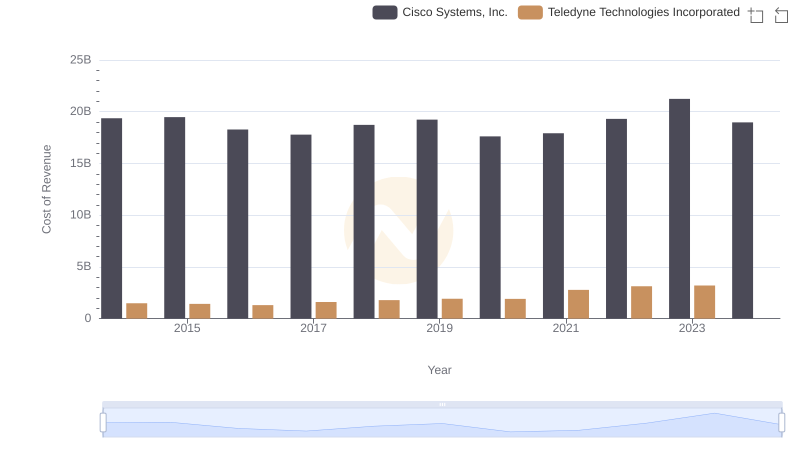
Cost of Revenue Comparison: Cisco Systems, Inc. vs Teledyne Technologies Incorporated
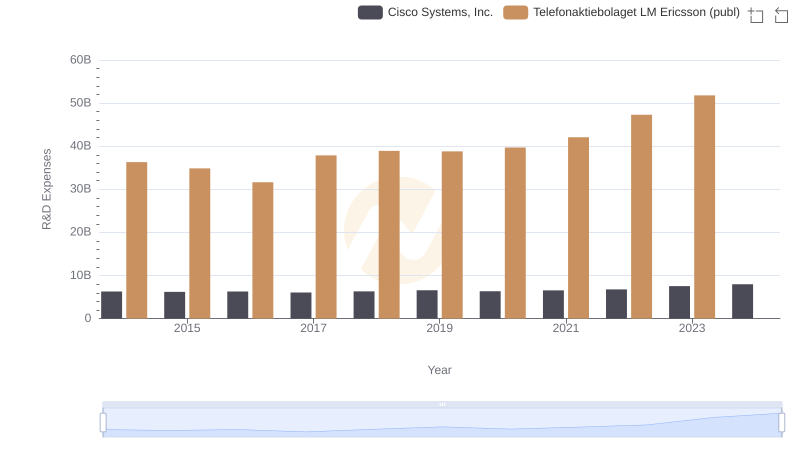
Research and Development: Comparing Key Metrics for Cisco Systems, Inc. and Telefonaktiebolaget LM Ericsson (publ)
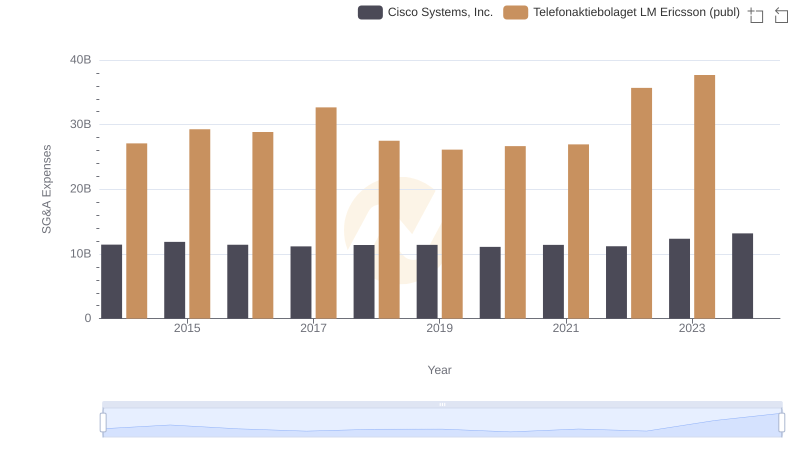
Operational Costs Compared: SG&A Analysis of Cisco Systems, Inc. and Telefonaktiebolaget LM Ericsson (publ)